
Below the line….alpha list of all graphics [in English] with embedded links. For Spanish-language graphics see AA Lista de Graficas (1) and [in reverse order as posted] AA Espanol (55). Updated 2 Aug 2013.
Click on the Link Above the Image to Reach Full Size Image, Comments, & Source Link
2012 USA Intelligence Scorecard – Deja Vu 2000 1 of 5

2012 USA Intelligence Scorecard – Deja Vu 2000 2 of 5

2012 USA Intelligence Scorecard – Deja Vu 2000 3 of 5

2012 USA Intelligence Scorecard – Deja Vu 2000 4 of 5

2012 USA Intelligence Scorecard – Deja Vu 2000 5 of 5

An API for Sharing & MindMap for Next Net

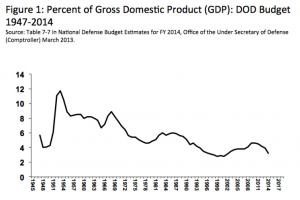
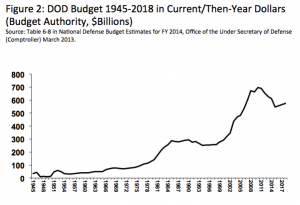
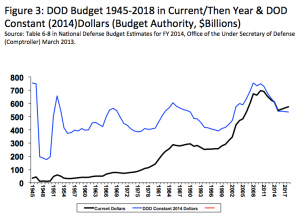
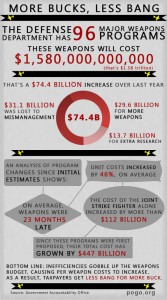
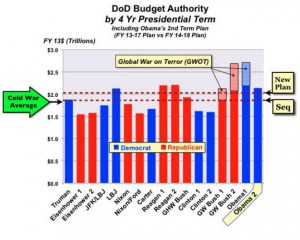
Graphic (4): Defense Budget Lies and Truth by Winslow Wheeler
Graphic (3): Extradimensional and extraterrestrial Existences
Graphic (3): Myth of Digital Democracy

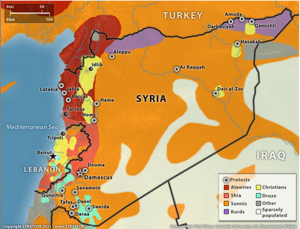
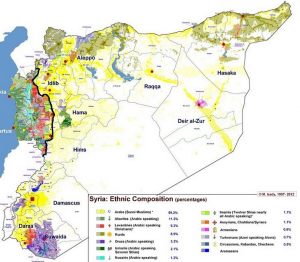
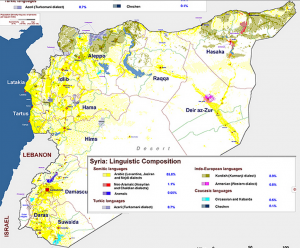
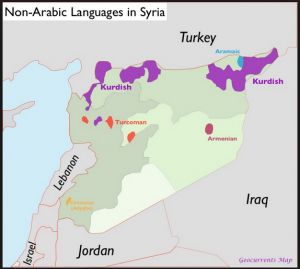
Graphics (4): Syria Sects, Ethnicity, Languages (2)
Graphic: #OWS Cover New Yorker 15 Aug 2011

Graphic: #OWS Cover New Yorker 24 Oct 2011

Graphic: #OWS Cover The Economist 22 Oct 2011

Graphic: #OWS Cover The Economist 24 Sep 201

Graphic: #OWS Cover The Week (UK) 22 Oct 2011

Graphic: #OWS Cover TIME 24 Oct 2011

Graphic(s): #OWS Facts of Life from Business Insider — 90% of the USA Screwed for 30 Years

Graphic(s): Sanity Rally Signs + Photo Gallery of Rally from The Washington Post

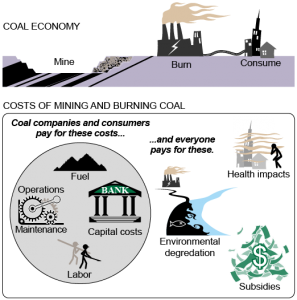
Graphic: “The True Cost of Coal”

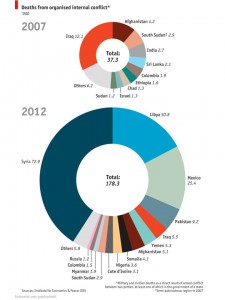
Graphic: 2012 versus 2007 Comparative Casualties from Global War
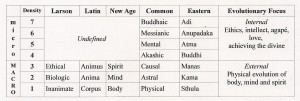
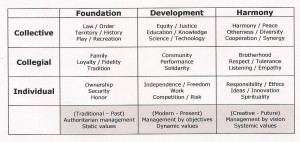
Graphic: 12 Elements in the Universe of Meaning
Graphic: 1989 USMC JNIDS VI Workup


Graphic: 1997 Toffler-Steele Building Blocks

Graphic: 1998 Homeland Vulnerability Pyramid

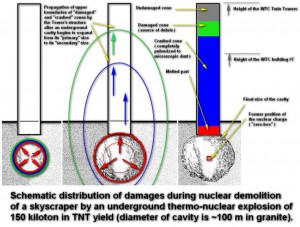
Graphic: 9/11 Nuclear Schematic from Dimitri Khalezov
Graphic: 2002 New Theory of War & Defense

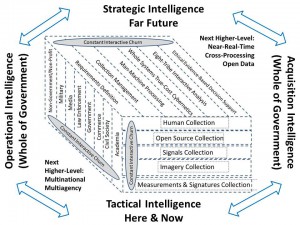
Graphic: 21st Century (Cybernetic) Intelligence Process 2.1 [Corrected, PPT Added]
Graphic: 21st Century Learner-Centered Digital Mobile Learning

Graphic: 21st Century Learner-Centered Five Fluencies

Graphic: 24/7 Participatory Budget-Policy

Graphic: 2D Representation of 3D Polyarchy

Graphic: 360 Degree View of the Frog

Graphic: 9-11 Commission Open Source Agency

Graphic: 99% Demand a Very Different Budget

Graphic: Accessing Knowledge with Visualization

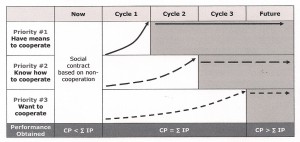
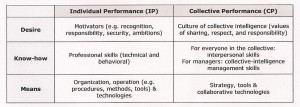
Graphic: Achieving Collective Intelligence — Means, Training, and Desire
Graphic: Adoption of Technology Curves – Silent Boom

Graphic: America the Beautiful

Graphic: American Addiction & Cultural Anhedonia

Graphic: Americans Elect Closes Down, Mission Accomplished

Graphic: Anthropocene Cities & Transportation
![]()
Graphic: Anthropocene Energy Channels & Nodes

Graphic: Anthropocene Indicators

Graphic: Anti-Sec Targeting Law Enforcement

Graphic: Arabs and Persians by Language

Graphic: Arabs and Persians by Tribe and Culture

Graphic: A Short Story-Terrorism as a Boil

Graphic: Academic Intelligence Tribe (1 of 8)


Graphic: Africa in Perspective


Graphic: Africa, Cell Phone Impact

Graphic: American Catastrophe I of III

Graphic: American Catastrophe II of III

Graphic: American Catastrophe III of III

Graphic: American Jihad (Map Based on Book)


Graphic: Americans Getting Poorer — FAST

Graphic: Analytic Pathologies Map

Graphic: Analytic Pathology Layers

Graphic: Analytic Tool-Kit in the Cloud

Graphic: Analytic Tool-Kit in the Cloud (CATALYST II)

Graphic: An Evolutionary Path for Intelligence
Graphic: Angela Merkel Discovers the Internet
Graphic: Arabs and Persians by Language
Graphic: Arabs and Persians by Tribe and Culture
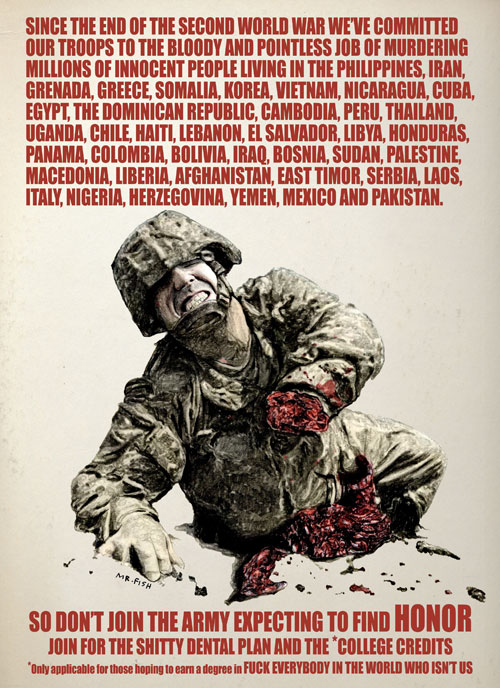
Graphic: Assassination Nation – 200 Years of Killing Hope

Graphic: Audio Track of WTC1 on 9/11


Graphic: Behavior Best Understood Via Evolution Lens


Graphic: Beyond Systems Thinking

Graphic: Beyond Water-Energy Nexus

Graphic: Big Bat USA Financial Comparisons

Graphic: Big Data Sucks — At Multiple Levels
Graphic: Big Picture View of Global Intelligence with Integrity Supporting Documents Added
Graphic: Billboards for Truth in Seattle Rejected

Graphic: Bimbo-Gate Flow Chart with Jill Kelley in Center

Graphic: Bio-Terror Report Card for USA – Failure
Graphic: Bjore – Forms of Open Intelligence

Graphic: Black Market / Shadow Economy
Billboard type graphic, click above to see.

Graphic: Bloomberg’s Circus (NO LABELS, America Elects, IndependentVoting.org)


Graphic: BrowsEarth Topic Map Part 2

Graphic: Building an Audio Collection for All the World’s Languages
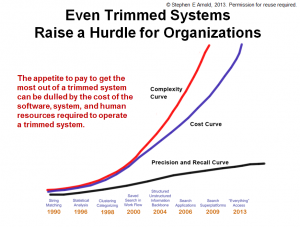
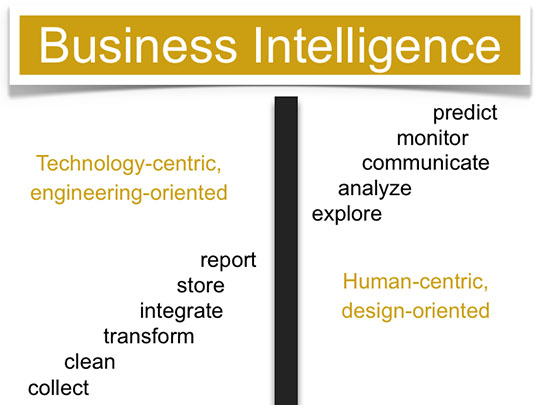
Graphic: Business Intelligence Hits the Wall
Graphic: Candidates on the Issues (2008)

Graphic: Cartoon of the Century – Crime Rules

Graphic: Case study of What NSA Can See of Your Day
Graphic: CD (Congo) 1:50,000 Combat Chart Shortfalls

Graphic: Centralized versus Decentralized Energy Paradigms

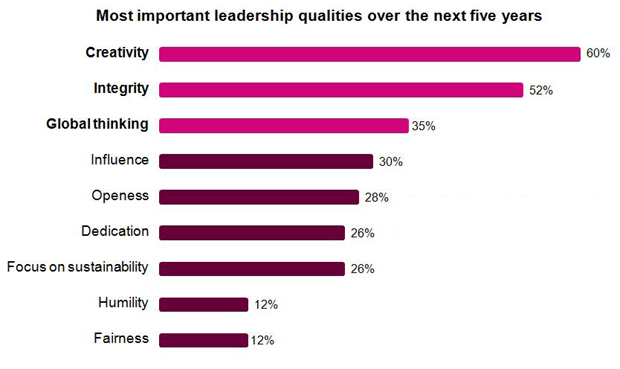
Graphic: CEO Study: Creativity (not Integrity) as the Most Important Leadership Quality for CEOs
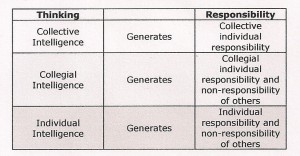
Graphic: Changes in Responsibility from Individual to Collective
Graphic: Changing Centers of Gravity for Intelligence in an Open World

Graphic: China-Centered View of the World

Graphic: Citizen-Centered Intelligence I

Graphic: Citizen-Centered Intelligence II (Warning)

Graphic: Civil Society Intelligence Tribe (2 of 8)

Graphic: Climate Change Drill Down Method

Graphic: Climate Change Hidden Connections

Graphic: Collection Sophistication

Graphic: Collective Intelligence Application Framework

Graphic: Collective Intelligence Books

Graphic: Collective Intelligence — Everything About the Process Changes
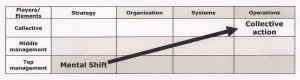
Graphic: Collective Intelligence Mind-Shift – Top Management Is Greatest Challenge
Graphic: Color-Coded Maps Showing Segregation in US Cities

Graphic: Commerce Intelligence Tribe (3 of 8)

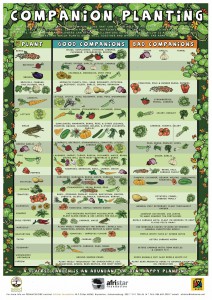
Graphic: Companion Planting (Alternative to Toxic Pesticides)

Graphic: Complex Earth Systems Model

Graphic: Concept for Liberation Communications

Graphic: Connecting the Dots from Ingestion Onwards

Graphic: Consciousness + Eight Processes


Graphic: Core Force for Multinational and Whole of Government Operations

Graphic: Corporate Democracy At Worst

Graphic: Corporate Democracy Eliminated

Graphic: Corporate Democracy with Move to Amend

Graphic: Corporate Media Selling War on Iran

Graphic: Corruption Slide 1 Nine Zones of Concern

Graphic: Corruption Slide 2 Empire as Terrorism

Graphic: Corruption Slide 3 Holistic Analysis

Graphic: Creating Trust — Differences in Collective Intelligence Mode
Graphic: Critical View of Bureaucracy (Brazil)

Graphic: Crony Capitalism, Goldman Sachs Variant


Graphic: Cutting US Deficit $11.7 Trillion


Graphic: Dark Social – Majority of Links NOT Facebook, Twitter, or Other

Graphic: Data Journalism Process Map

Graphic: Data Production World-Wide by the Minute

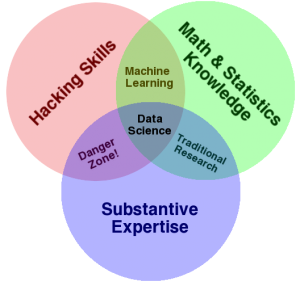
Graphic: Data Science in Context

Graphic: Declaration of Internet Freedom

Graphic: Deficit Legacy Factors


Graphic: Dialog, Deliberation, & Choice-Creating

Graphic: Dick Cheney and Muammar Gaddafi

Graphic: Difference Between a Boss and a Leader

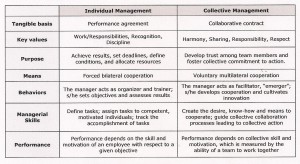
Graphic: Differences Between Individual and Collective Management
Graphic: Digital Learners versus Analog Teachers


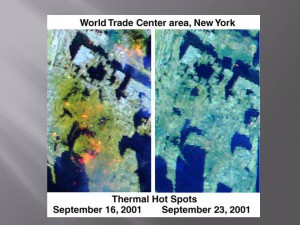
Graphic: Documented Hot Spots Five Days After 9/11
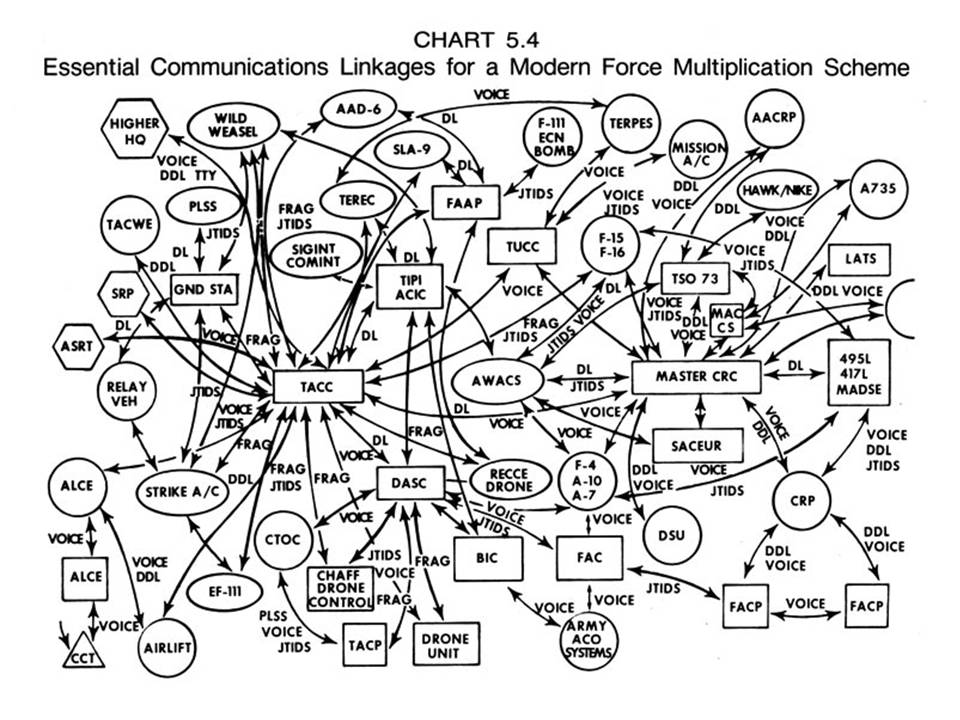
Graphic: DoD Intellectual Spagetti Cold War Version
Graphic: DoD Weapons — 41% Documented Waste Per Year — 60% More Probable

Graphic: Dumber, Blunder, & Plunder

Graphic: Dunkirk II – UK Long Road from Afghanistan

Graphic: Dutch Information Infrastructure Core Slide

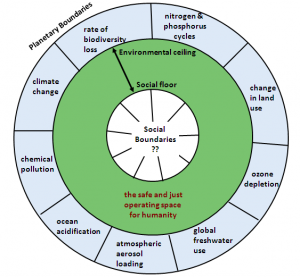
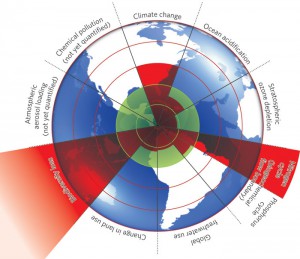
Graphic: Earth Boundaries Doughnut
Graphic: Earth Boundaries Doughnut with Red Zones
Graphic: Earth Brain, Desktop Level

Graphic: Earth Intelligence Network Founders

Graphic: Earth Intelligence Network Seal


Graphic: Earth Rescue Network Patch (New)

Graphic: Earth Rescue Network Patch (Original)


Graphic: Earthquake Basics, Nuclear Insanity
![]()

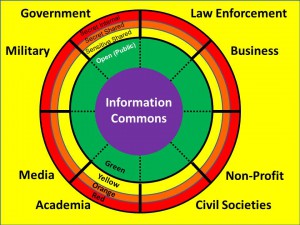
Graphic: Eight “Tribes” or Communities of Information & Intelligence

Graphic: Elements of Intelligence

Graphic: End of Humanity on Earth Possible

Graphic: Engineering Interventions

Graphic: Epoch B Multinational Network Rising

Graphic: Epoch B Swarm Leadership

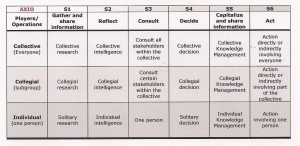
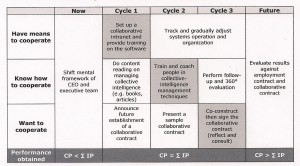
Graphic: Essential Task Across Cycles to Achieve Collective Intelligence
Graphic: Ethical Evidence-Based Decisions

Graphic: Ethical Reasoning Wheel


Graphic: Ethics Holistic Overview

Graphic: Eustace Mullins Bankster Gangster Illustration

Graphic: Eustace Mullins Pyramid of Financial, Political, & Violent Crimes Against Humanity

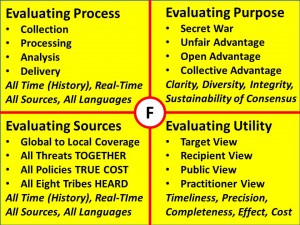
Graphic: Evaluating Intelligence (Decision-Support) – Four Aspects 1.1
Graphic: Expanding the Open Source Revolution

Graphic: Expeditionary Environment Analytic Model

Graphic: Fascism USA Flag – Shocking First Time Image

Graphic: Federal Reserve QE3 Shifts Inflation Burden to the Poor, Finishes Off the Middle Class

Graphic: Fifteen Global Challenges (Millenium Project)

Graphic: Five Common Myths About Open Source

Graphic: Five Migration Paths from Peter Senge et all


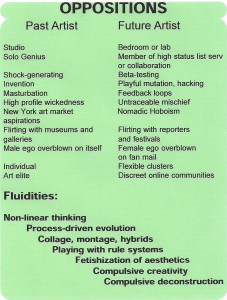
Graphic: Fluidities I by Anne-Marie Schleiner
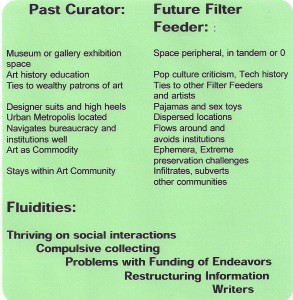
Graphic: Fluidities II by Anne-Marie Schleiner
Graphic: Four Forces After Next with IO

Graphic: Four Global Belligerent Groups Today

Graphic: Four Major Systems for Resilience

Graphic: Four National Reforms

Graphic: Four Quadrants J-2 High Cell SMS Low

Graphic: four quadrants of organizational culture

Graphic: Four Stages of the Resilience Cycle


Graphic: Fourth Sector Hybrid Value-Creation Model

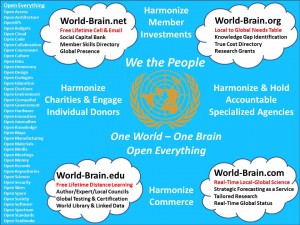
Graphic: Four World-Brain Web Sites in University of the 21st Century Context

Graphic: Fragmented Knowledge to World Brain 4.0

Graphic: Freedom on the Internet 2012 Chart

Graphic: Freedom on the Internet 2012 Map

Graphic: Fresh Water in Relation to All Water

Graphic: From Culture of Individual Performance to Culture of Collective Collaboration
Graphic: From Text to Graphics to Sound

Graphic: Fukushima Radioactive Debris (Across An Area Larger than Central Park in NYC)

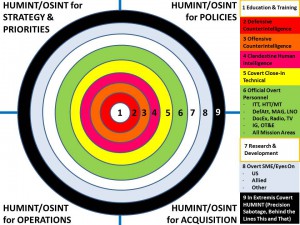
Graphic: Full Spectrum Human Intelligence (HUMINT)

Graphic: Functions of the State (Internal Aspect)

Graphic: GAO Audit In One Graphic – Banks Buying Politicians

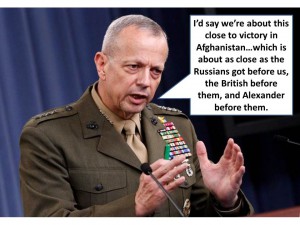
Graphic: General John R. Allen, USMC: On Victory in Afghanistan
Graphic: Gas Exporting Countries — the Twin to OPEC
Graphic: General Strike Liberate Oakland

Graphic: GIS Makes Discrimination Black and White

Graphic: Global Brain at Infancy (Facebook)

Graphic: Global Game of Go Seen in Emails
Graphic: Global Intelligence Collection Failure

Graphic: Global Intelligence Processing Failure

Graphic: Global Range of Nano-Needs

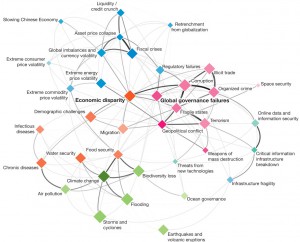
Graphic: Global Risk Interconnnected with Cascade Potential
Graphic: Global Threats to Local Survival (1990′s)

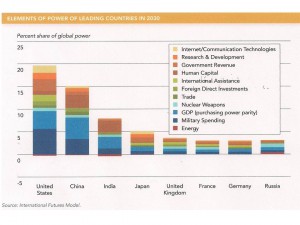
Graphic: Global Trends 2030 Elements of Country Power
Graphic: Global Trends 2030 US GDP Comparative Collapse
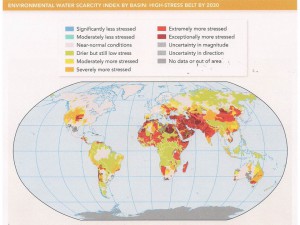
Graphic: Global Trends 2030 Water Stress
Graphic: Global Warming Perceptions


Graphic: Google Evil Equated to China

Graphic: Government Budget Increase = More Unemployment

Graphic: Government Executive Cuts 1 Trillion Over Ten Years – Still Borrows a Trillion a Year

Graphic: Government Intelligence Tribe (3 of 8)


Graphic: Gray Eagles Gather to Defend Against All Enemies, Domestic & Foreign

Graphic: Harnessing Collective Wisdom

Graphic: Health Quadrants & Open Source Information

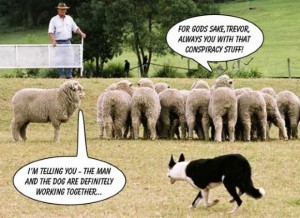
Graphic: Herd of Sheep Reacts to Conspiracy Theory
Graphic: Herring Triangle as Published in New Craft of Intelligence

Graphic: Herring Triangle of Four Levels Need & Cost

Graphic: History of Life on Earth & Human Evolution


Graphic: Holistic Analytics for Nuclear-Climate

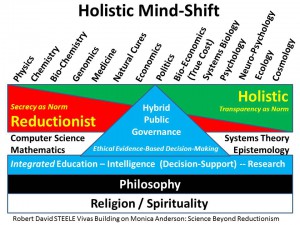
Graphic: Holistic Mind-Shift Toward Hybrid Public Governance of the Whole by the Whole for the Whole

Graphic: How Safe is Pepper Spray? BANNED as a Chemical Weapon Worldwide

Graphic: Human Evolution Stages of Development

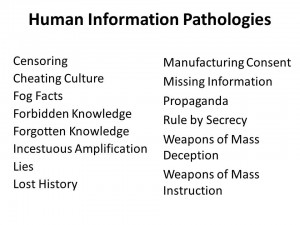
Graphic: Human Information Pathologies
Graphic: Human Intelligence (HUMINT) 101 (Wrong Way)

Graphic: Human Intelligence (HUMINT) 102 (Right Way)

Graphic: Human Intelligence (HUMINT) J-2 Central

Graphic: Human Terrain Team Self-Concept

Graphic: Hybrid Terrestial-Satellite Wireless

Graphic: IADB 21st Century Intelligence
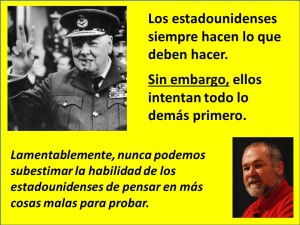
Graphic: IADB Churchill and Steele in Spanish
Graphic: IADB Eight Tribes and Information Commons
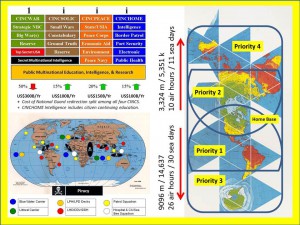
Graphic: IADB New Strategy & Force Structure
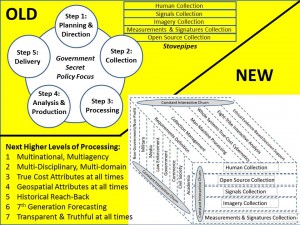
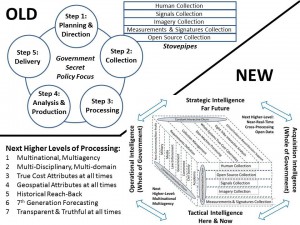
Graphic: IADB Old vs. New Intelligence Process
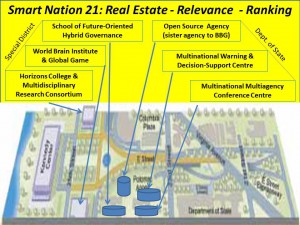
Graphic: IADB Open Source Agency Real Estate 1 of 2
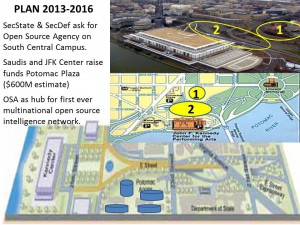
Graphic: IADB Open Source Agency Real Estate 2 of 2
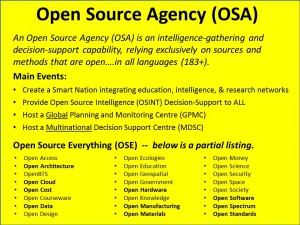
Graphic: IADB Open Source Agency Summary
Graphic: IBM Big Data (Severely Retarded)

Graphic: If Guns Kill People, Do Spoons Make You Fat?

Graphic: Inflation as a Massive Tax on the Public

Graphic: Influences on Policy Maker (1995)

Graphic: Infographic: The Effects of Coal on Water in the US

Graphic: Info-Graphics/Maps: provoking resources to explore & learn
Many links, click above.
Graphic: Information Commons & Eight Tribes

Graphic: Information Continuum (1995)
")
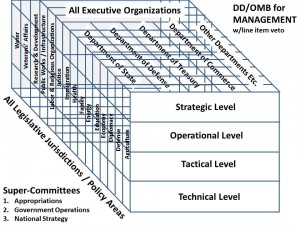
Graphic: Information Operations (IO) Cube

Graphic: Information Operations (IO) Eras

Graphic: Information Pathologies

Graphic: Information Sharing–Going for the Green

Graphic: Information Filters for 21st Century Infotention

Graphic: Injection Wells Poisoning Aquifers

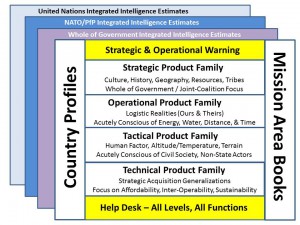
Graphic: Integrated Intelligence Product Families
Graphic: Integrity in All Respects


Graphic: Intelligence Data Management

Graphic: Intelligence Leadership
Graphic: Intelligence Management of Bad Data

Graphic: Intelligence Maturity Scale (Original)


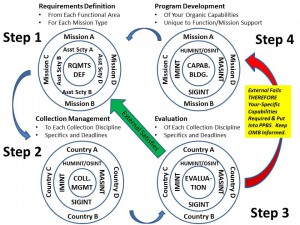
Graphic: Intelligence Requirements, Collection, Evaluation, and Capabilities Building

Graphic: Intelligence Requirements Definition for the 21st Century

Graphic: Intelligence Standards

Graphic: Inter-Agency Collaboration

Graphic: Internet2 Open Science Open Flow Concept

Graphic: Intersection of Man and World

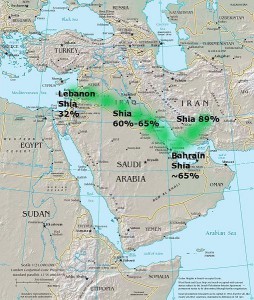
Graphic: Iran’s Shia Land Bridge to Lebanon & Mediterranean
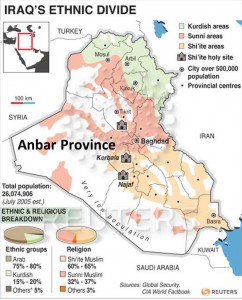
Graphic: Iraq’s Ethnic Divide — And Contiguous Nations
Graphic: It’s Official, Al Gore is a Prophet

Graphic: Jan Herring’s Triangle for Decision-Support

Graphic: Japan Disaster in Figures 25 March 2011

Graphic: Jim Bamford on the Human Brain

Graphic: Knowledge, Trust, & Development

Graphic: Knowledge Wheel (Intelligence 101)
Graphic: Kurdish Distribution Across Middle East


Graphic: Largest Financial Scam in History – Libor, Wall Street, the Federal Reserve & You

Graphic: Law Enforcement Intelligence (4 of 8)

Graphic: Lawrence Lessig on Spending for Democracy in Iraq vs. USA

Graphic: Library Behind this Public Intelligence Blog

Graphic: LibreOffice on the Rise – Multiple Charts

Graphic: Life 101-The Tetrahedron

Graphic: Life 102–Open Everything

Graphic: Linear versus Diamond Paradigm

Graphic: M4IS2 OpenBTS, Call Centers, Diasphora

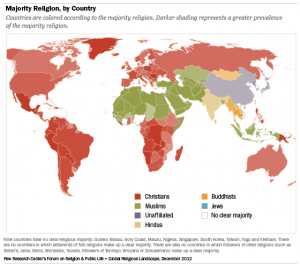
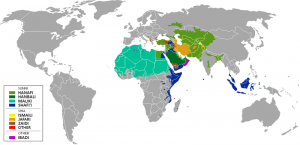
Graphic: Majority Religion By Country
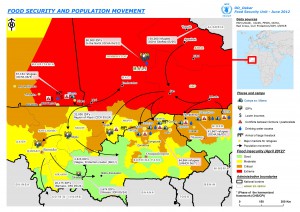
Graphic: Mali Food Insecurity, Refugees, & Islamists
Graphic: Map of Occupations Across USA

Graphic: Mapping Value Diffences in Collective Intelligence
Graphic: Map Syria Iran + Syria-Iran-Rergional RECAP

Graphic: Martin Luther King and Occupy Wall Street

Graphic: Maslow Hierarchy of Needs

Graphic: May the Crowd Be With You…

Graphic: Medard Gabel’s Cost of Peace versus War

Graphic: Media Intelligence Tribe (5 of 8)

Graphic: Meeting 21st Century Transnational Challenges – Building a Global Intelligence Paradigm

Graphic: Meeting in Middle–End Subsidized Wealth

Graphic: Mexican Cartel Spreading Influence Across USA & Death Tolls

Graphic: Michael Markowitz Consumer Needs Hierarchy

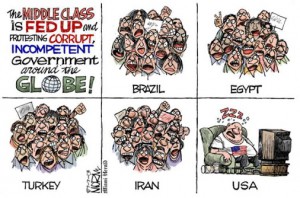
Graphic: Middle Class Protesting Globally — Except in the USA
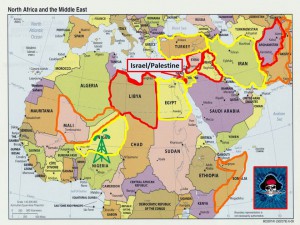
Graphic: Middle East North Africa Swath of Strategic Decrepitude

Graphic: Mike Bloomberg Tests Cyber-Perceptions

Graphic: Military Intelligence Tribe (7 of 8)

Graphic: Military Open Source Software – I Want You!

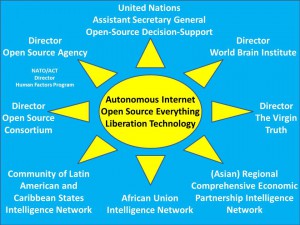
Graphic: MindMap Open Source Everything
Links, click on above.

Graphic: Mother Jones on Wealth, Productivity, & Wages

Graphic: Multi-Lateral Sharing

Graphic: Multi-Level Technical Approach to Intelligence 21

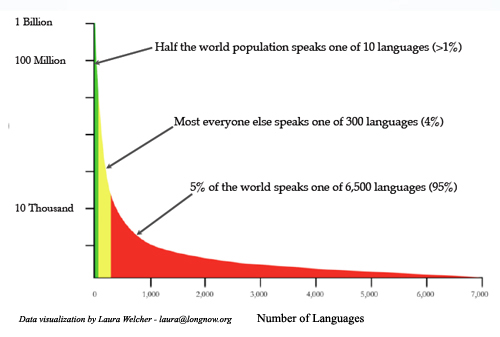
Graphic: Multi-Lingual Reality


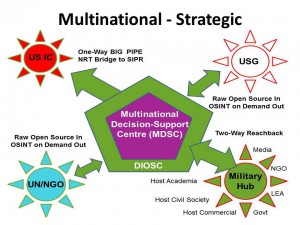
Graphic: Multinational Decision-Support Centre Concept of Operations
Graphic: Multinational IO + OSINT = IO2

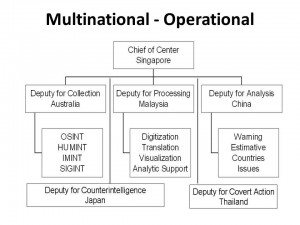
Graphic: Multinational Regional Intelligence-Operations Support Centre (Station)
Graphic: Muslim (Islam) Spread Worldwide

Graphic: Muslim Distribution MENA Heartland

Graphic: Muslim Groups (Major) in Central Asia

Graphic: Muslim Percent by Country (Global)

Graphic: Muslim Population by Country


Graphic: Muslim Sunni – Shi’ite Distribution (Global)

Graphic: Muslim Sunni-Shi’ite MENA

Graphic: Muslim Sunni – Shi’ite Percentages

Graphic: National Debt Burden 1929 – 2011

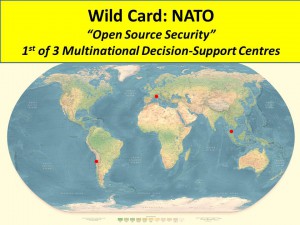
Graphic: NATO Wild Card – 1st of 3 Multinational Decision-Support Centres?
Graphic: Neo-Facism Comparisons

Graphic: Network Learning Path to the Future

Graphic: Network-Oriented Resilience Metrics

Graphic: New Balance for the New Craft of Intelligence

Graphic: New Global Integrated Intelligence Community

Graphic: New Internet-Era Needs Triangle

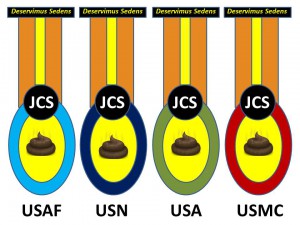
Graphic: New JCS Medal — We Who Sit, Serve
Graphic: New Logo for Earth Intelligence Network
![]()
Graphic: Next Net MindMap (Evolving)

Graphic: Nine Nations of North America

Graphic: Nine Planetary Boundaries

Graphic: Nine Remedial Capacity Boundaries

Graphic: Nine Variations of Islam

Graphic: No More United States of Israel – Heal at Home First

Graphic: Non-Partisan Reality-Based Governance

Graphic: Nuclear Incidents Since 1952

Graphic: Nuclear Plants & Seismic Zones (Global)
![]()
Graphic: Nuclear Plants & Seismic Zones (USA)
![]()
Graphic: Nuclear Risk Centered on Asia
![]()
Graphic: Nuclear Risk to Populations (USA)
![]()
Graphic: Obama’s Change – Had Enough?

Graphic: Obama Hawaii Birth in TWO Newspapers PLUS Repudiation of Forged Kenyan Document

Graphic: Obama Kenyan Birth Certificate 1 of 4

Graphic: Obama Kenyan Birth Certificate 2 of 4

Graphic: Obama Kenyan Birth Certificate 3 of 4

Graphic: Obama Kenyan Birth Certificate 4 of 4

Graphic: Obama Plays War Games…

Graphic: Obama Zombie Bin Laden Poster


![]()


Graphic: Oil and Large Unemployed Youth Populations


Graphic: Old Versus New Intelligence Process
Graphic: One Vision for the Future of Microsoft

Graphic: OODA Loop (Observe, Orient, Decide, Act)

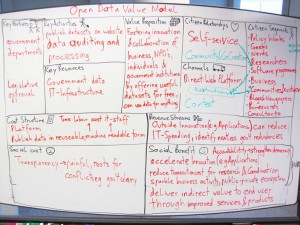
Graphic: Open Data Value Model
Graphic: Open Everything (Original)


Graphic: Open Science Sharing is Caring

Graphic: Open Source Agency Broad Concept

Graphic: Open Source Agency Broad Organization

Graphic: Open Source Agency Clients & Commanders

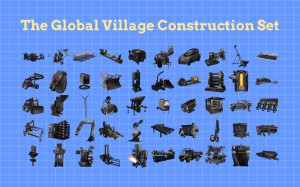
Graphic: Open Source Ecology Global Village Construction Set
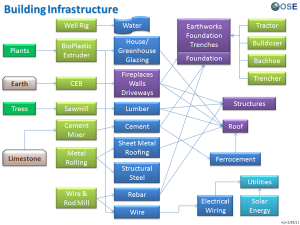
Graphic: Open Source Ecology Product Process Chart (Building Infrastructure)
Graphic: Open Source Everything Logo
![]()
Graphic: Open Source Everything – Open World

Graphic: Open Source Everything (Zeitgeist)
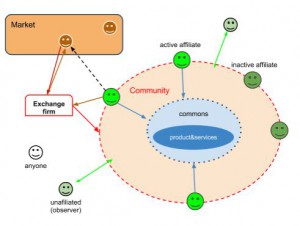
Graphic: Open Source Hardware Economic Model
Graphic: Opening the World 1 of 2

Graphic: Opening the World 2 of 2

Graphic: Organizational Tools for Changing Culture

Graphic: Original Banzai by Col Walt Breede III, USMC

Graphic: OSE M4IS2 Logo & The Game Plan
Graphic: OSINT & Universal Coverage at Local Level

Graphic: OSINT All-Source Temple

Graphic: OSINT and Full-Spectrum HUMINT (Updated)

Graphic: OSINT and Lack of Processing

Graphic: OSINT and Missing Information

Graphic: OSINT and Multinational Defense in Depth


Graphic: OSINT by InfoSphere (Company)

Graphic: OSINT by InfoSphere (Nation)

Graphic: OSINT by InfoSphere (Overview)


Graphic: OSINT Competing Models


Graphic: OSINT Global Pyramid from OSIS-X to Intelink-X


Graphic: OSINT Multinational Information Operations

Graphic: OSINT Multinational Outreach Network


Graphic: OSINT Quadrants and Green to Red Feed

Graphic: OSINT Support to Four Levels of Analysis


Graphic: OSINT versus OSIS (Information Overload)

Graphic: OSINT, Missions, & Disciplines

Graphic: OSINT, We Went Wrong, Leaping Forward

Graphic: Overview of Big Bat 21
 3.0 JPEG")

Graphic: Panarchy as Ecological Resilience System

Graphic: Panarchy Pace Layering (Stewart Brand)

Graphic: Panarchy The Self in Hyperconnectivity


Graphic: Participatory Budget Outreach

Graphic: Participatory Polyarchy

Graphic: Patterns of Public Debt Burden 1929-2011

Graphic: PC Microsoft Out, Tablet Android In

Graphic: Peer to Peer Governance

Graphic: Pentagon Budget Fraud — Lies as Treason
Graphic: Pentagon Focused on 10% of the Threat

Graphic: Platform Adoption Ramps (Log Scale)

Graphic: Political Factions 002
Graphic: Post-Katrina New Orleans Myths & Off-Shore Drilling

Graphic: Pre-Conditions of Revolution

Graphic: Preconditions of Revolution in the USA Today
 1.1 JPEG")
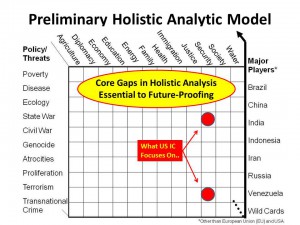
Graphic: Preliminary Holistic Analytic Model
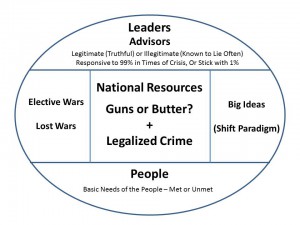
Graphic: President and Humanity

Graphic: Principles of War versus Principles of Peace

Graphic: Profiles of Terrorism in USA

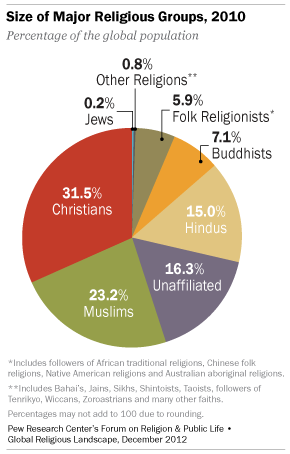
Graphic: Proportional Size of Major Religious Groups

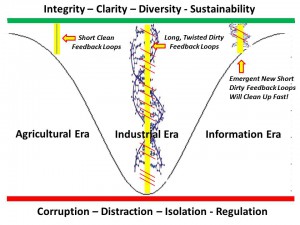
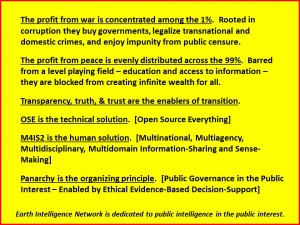
Graphic: Public Governance & Feedback Loop Integrity Enhanced by Public Intelligence
Graphic: Public Governance in the 21st Century

Graphic: Public Trust and Finance Network

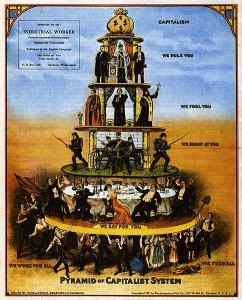
Graphic: Pyramid of Capitalism
Graphic: Reality 101 Reading Areas

Graphic: Reality 102 Strategic Forces Being Ignored

Graphic: Real Organizational Chart

Graphic: Rebooting USA Operating System

Graphic: Regional Information-Sharing and Sense-Making Centre

Graphic: Regional Intelligence Center for Peacekeeping
")
Graphic: Resilience Adaptive Cycle Three Dimensions


Graphic: Revolution Model Simplified
Graphic: Revolving Door-Goldman, City, Morgan Et Al

Graphic: Robert Steele Adopts Buckminster Fuller

Graphic: Rolf Sattler’s Dynamic Mandala Map

Graphic: Russian Image of Earth

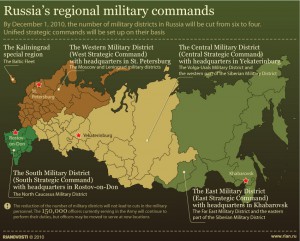
Graphic: Russian Military Districts — Israel as Target
Graphic: Satellite Bandwidth for Terrestial Use

Graphic: Science, Religion, & Philosophy

Graphic: Science, Religion, & Philosophy (Old)


Graphic: Seven Tribes of Intelligence (Original)

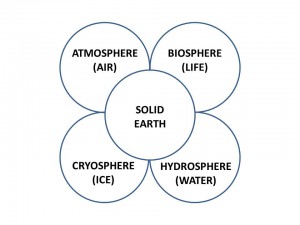
Graphic: Simplified Earth Systems Model
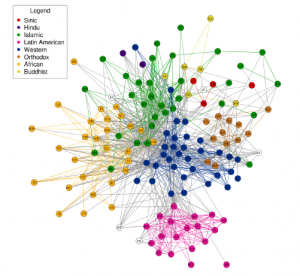
Graphic: Simplified World Conflict Map

Graphic: Six Circles–Earth Intelligence Network Operational Concept

Graphic: Smart Nation Through Four Reforms

Graphic: Smart Nation World Brain Pyramid


Graphic: Smart Safe Nation via Intelligence with Integrity in Four Quadrants – USA Fails

Graphic: Stages of Tribal Intelligence and Integrity

Graphic: Steele at Hackers Briefing Cover

Graphic: Strategic Analytic Matrix

Graphic: Strategic Intelligence Secretariat United Nations

Graphic: Strategic Narrative Process Model

Graphic: Strategic Trends (Negative)
")
Graphic: Strategic Trends (Positive)
")

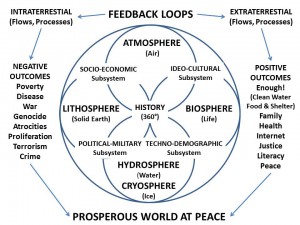
Graphic: Strategy for a Prosperous World at Peace

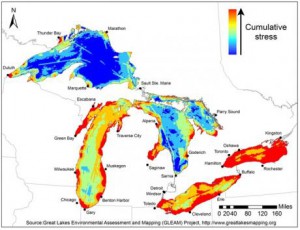
Graphic: Stress on Great Lakes Water + Water RECAP

Graphic: Ten High-Level Threats to Humanity


Graphic: The Financial Desecration of the UK Flag

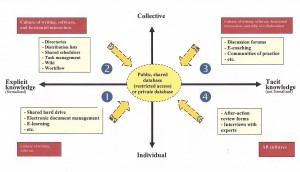
Graphic: The Four Quadrants of Knowledge

Graphic: Theft One – Black Hole of Unwarranted Interest

Graphic: Theft Two – Unwarranted Interest as Drain on Economy

Graphic: Theft Three – Sucking Sound from “Above”

Graphic: Theft Four – Sucking Sounds Explained

Graphic: Theft Five – Chronic Deflation

Graphic: Theft Six – Eastman Model of Toxic Usury

Graphic: Theft Seven – What Is To Be Done I of II

Graphic: Theft Eight – What Is To Be Done II of II


Graphic: The Internet of Things (Beecham Research)

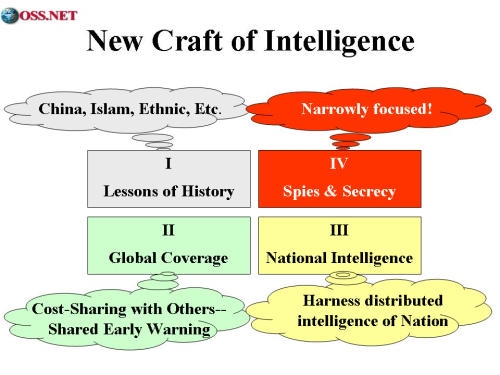
Graphic: The New Craft of Intelligence
Graphic: The Obama Economy At A Glance

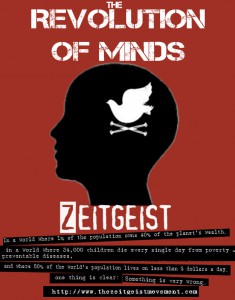
Graphic: The Revolution of Minds (Zeitgeist)
Graphic: The Revolution Will Be Tweeted

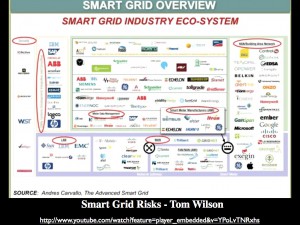
Graphic: The Smart Grid — Is This Also the New Spy Grid?
Graphic: The UN and the Eight Tribes of Intelligence

Graphic: The Virgin Truth Sir Richard Branson Connecting the Dots

Graphic: Thought Police Poster

Graphic: Threat Level Changes Depending on the Level of Analysis

Graphic: Time Saving Truth from Falsehood

Graphic: Tom Atlee on Whole-System Intelligence

Graphic: Tony Zinni on 4% “At Best”

Graphic: Top Business Intelligence Companies

Graphic: Topic Maps and How We Think

Graphic: Topic Maps How We Really Think

Graphic: Top Ten Killers In USA – Guns are LAST

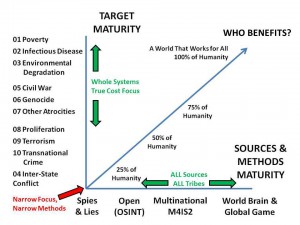
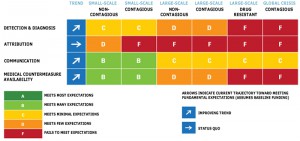
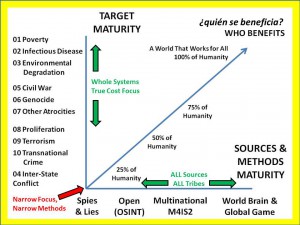
Graphic: Top Ten Threats to Humanity – Relevance of Open Sources & Methods

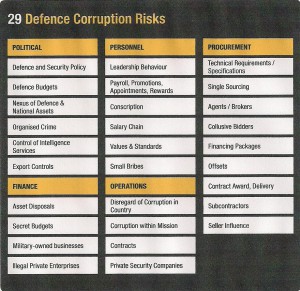
Graphic: Transparency International Defense Corruption Elements
Graphic: True Cost of a Cotton T-Shirt

Graphic: True Cost of Sugar to Society


Graphic: Truth, Love, & Power – Intelligence, Oneness, & Authority
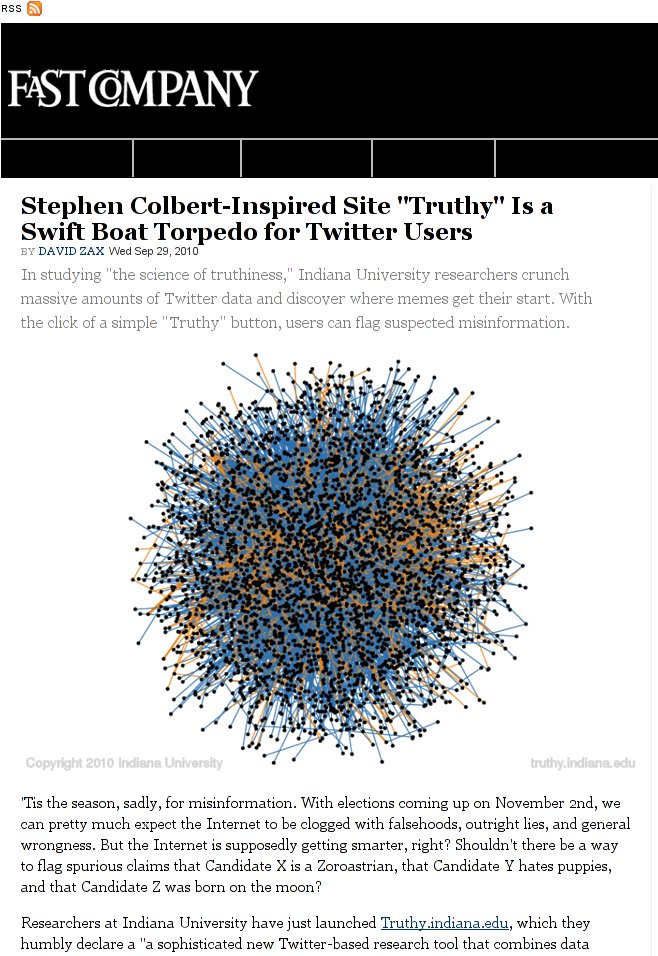
Graphic: Twitter as an Intelligence Tool

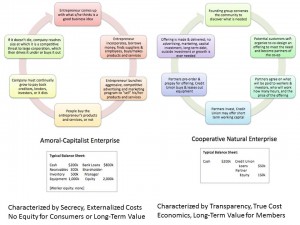
Graphic: Two Economic Models — One Amoral, One Moral

Graphic: Two-Party Political Sex Behind Closed Doors


Graphic: UN Big Picture View of Global Intelligence with Integrity Supporting Documents Added
Graphic: UN 1 Cost of Peace vs. Cost of War [Converted to Endnote]
| US20B End Starvation & Malnutrition | US17B Safety for All |
| US12B Clean Water for All | US30B Retire Debt/Credit for All |
| US23B Health Care for All | US45B Energy for All (Clean, Safe) |
| US21B Shelter for All | US11B Population Stabilization for All |
| US10B Education for All | US12B Democracy & Diversity for All |
| TOTAL FOR PEACE: US201B/Year | TOTAL NOW FOR WAR: US1T/Year |
Graphic: UN 1 One World — One Brain — Open Everything
Graphic: UN 2 Data-Driven Gift Need and Delivery Aggregation and Accountability

Graphic: UN 3 Bottom-Up Approach to Peace Governance

Graphic: UN 4 Data-Driven Public Governance

Graphic: UN 5 Open Source Everything (OSE) Circles

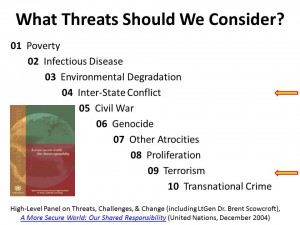
Graphic: UN 6 OSINT Relevance to UN Ten High-Level Threats
| Economic and Social Threats, including | 95% | |
| 01 | Poverty | 99% |
| 02 | Infectious Disease | 95% |
| 03 | Environmental Degradation (includes Climate Change) | 90% |
| 04 | Inter-State Conflict | 75% |
| Internal-Conflict, including | 90% | |
| 05 | Civil War | 80% |
| 06 | Genocide | 95% |
| 07 | Other Large-Scale Atrocities | 95% |
| 08 | Proliferation of nuclear, radiological, chemical, and biological weapons (many would add small arms as well) | 75% |
| 09 | Terrorism (often mis-labeled and actually internal conflict) | 80% |
| 10 | Transnational Organized Crime | 80% |
Graphic: UN 7 Intelligence Requirements Four Levels of Analysis

Graphic: UN 8 Information Strategy for 21st Century

Graphic: UN 9 Strategic Analytic Model for UN System Intelligence
 Strategic Analytic Matrix")
Graphic: UN 10 – 2 Open Sources Limited Secret Sources Now, Plus Eight Tribes

Graphic: UN 11 UN-Centric Extended Circles of Information Sharing and Sense-Making

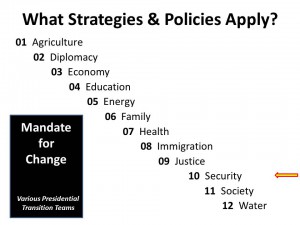
Graphic: UN 12 Overlay of UN Organizations with Strategic Threats & Policies

Graphic: UN 13 Earth Intelligence Network “Six Bubbles”

Graphic: UN 14 Open-Source Decision-Support Information Network (UNODIN) Pyramid

Graphic: UN 15 UNODIN as Service of the Commons — Five Layers
Graphic: UN-Centric Global Information-Sharing

Graphic: UN Cluster Approach to Humanitarian & Emergency Relief Coordination

Graphic: UN Open-Source Decision-Support Information Network (UNODIN) Pyramid
Graphic: UN Information Strategy for 21st Century
Graphic: UN Intelligence Requirements Definition
Graphic: UN Joint Military Analysis Center (Dorn)

Graphic: UN Level 3 Emergency Timeline

Graphic: UN Open-Source Decision-Support Information Network (UNODIN) Pyramid
Graphic: UN Tools & Methods (Walter Dorn) Updated

Graphic: United Nations (UN) & Non-Governmental Organization (NGO) Intelligence Tribe (8 of 8)

Graphic: Updated US Swath of Destruction from Afghanistan to Niger
Graphic: USA 2011 Gap Between Expenses and Revenue — Largest “Peacetime” Gap in US History

Graphic: USA 2012 Republican Governors & Swing States

Graphic: USA Economic Split from 1980 Onwards

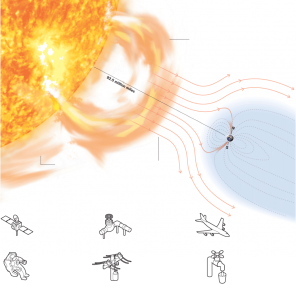
Graphic: USA Loss of Service Cascade from Electromagnetic Pulse Bombs

Graphic: USA Real Fiscal Cliff – Entitlements & Interest Exceed Revenue in 15 Years

Graphic: USA Real Median Household Income Index

Graphic: US Counties Protected by Levees


Graphic: US Defense Spending 2000-2011 ($B)

Graphic: US DoD Budget 1948-2011

Graphic: US Dollar Decline (4 Periods Compared)

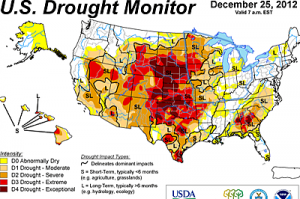
Graphic: US Drought 25 December 2012

Graphic: US Google Map for WikiLeaks Searches

Graphic: US Intelligence Community Rat’s Nest

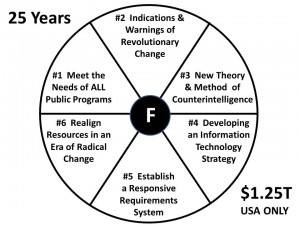
Graphic: US Intelligence Six Fundamental Failures Over 25 Years – $1.25 Trillion
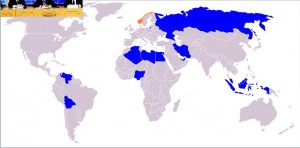
Graphic: US Military Bases World-Wide

Graphic: US Military Spending Adjusted for Inflation has DOUBLED from 1962 to 2012
Graphic: US Nuclear Plants in Earthquake Zones
![]()
Graphic: US Nuclear Plants in Flood Zones
![]()
Graphic: US Nuclear Risk in Relation to Dam Failures
![]()

Graphic: US Special Operations “Shredded Spear” 1.1

Graphic: Viet-Nam Safe Conduct/Surrender Passes

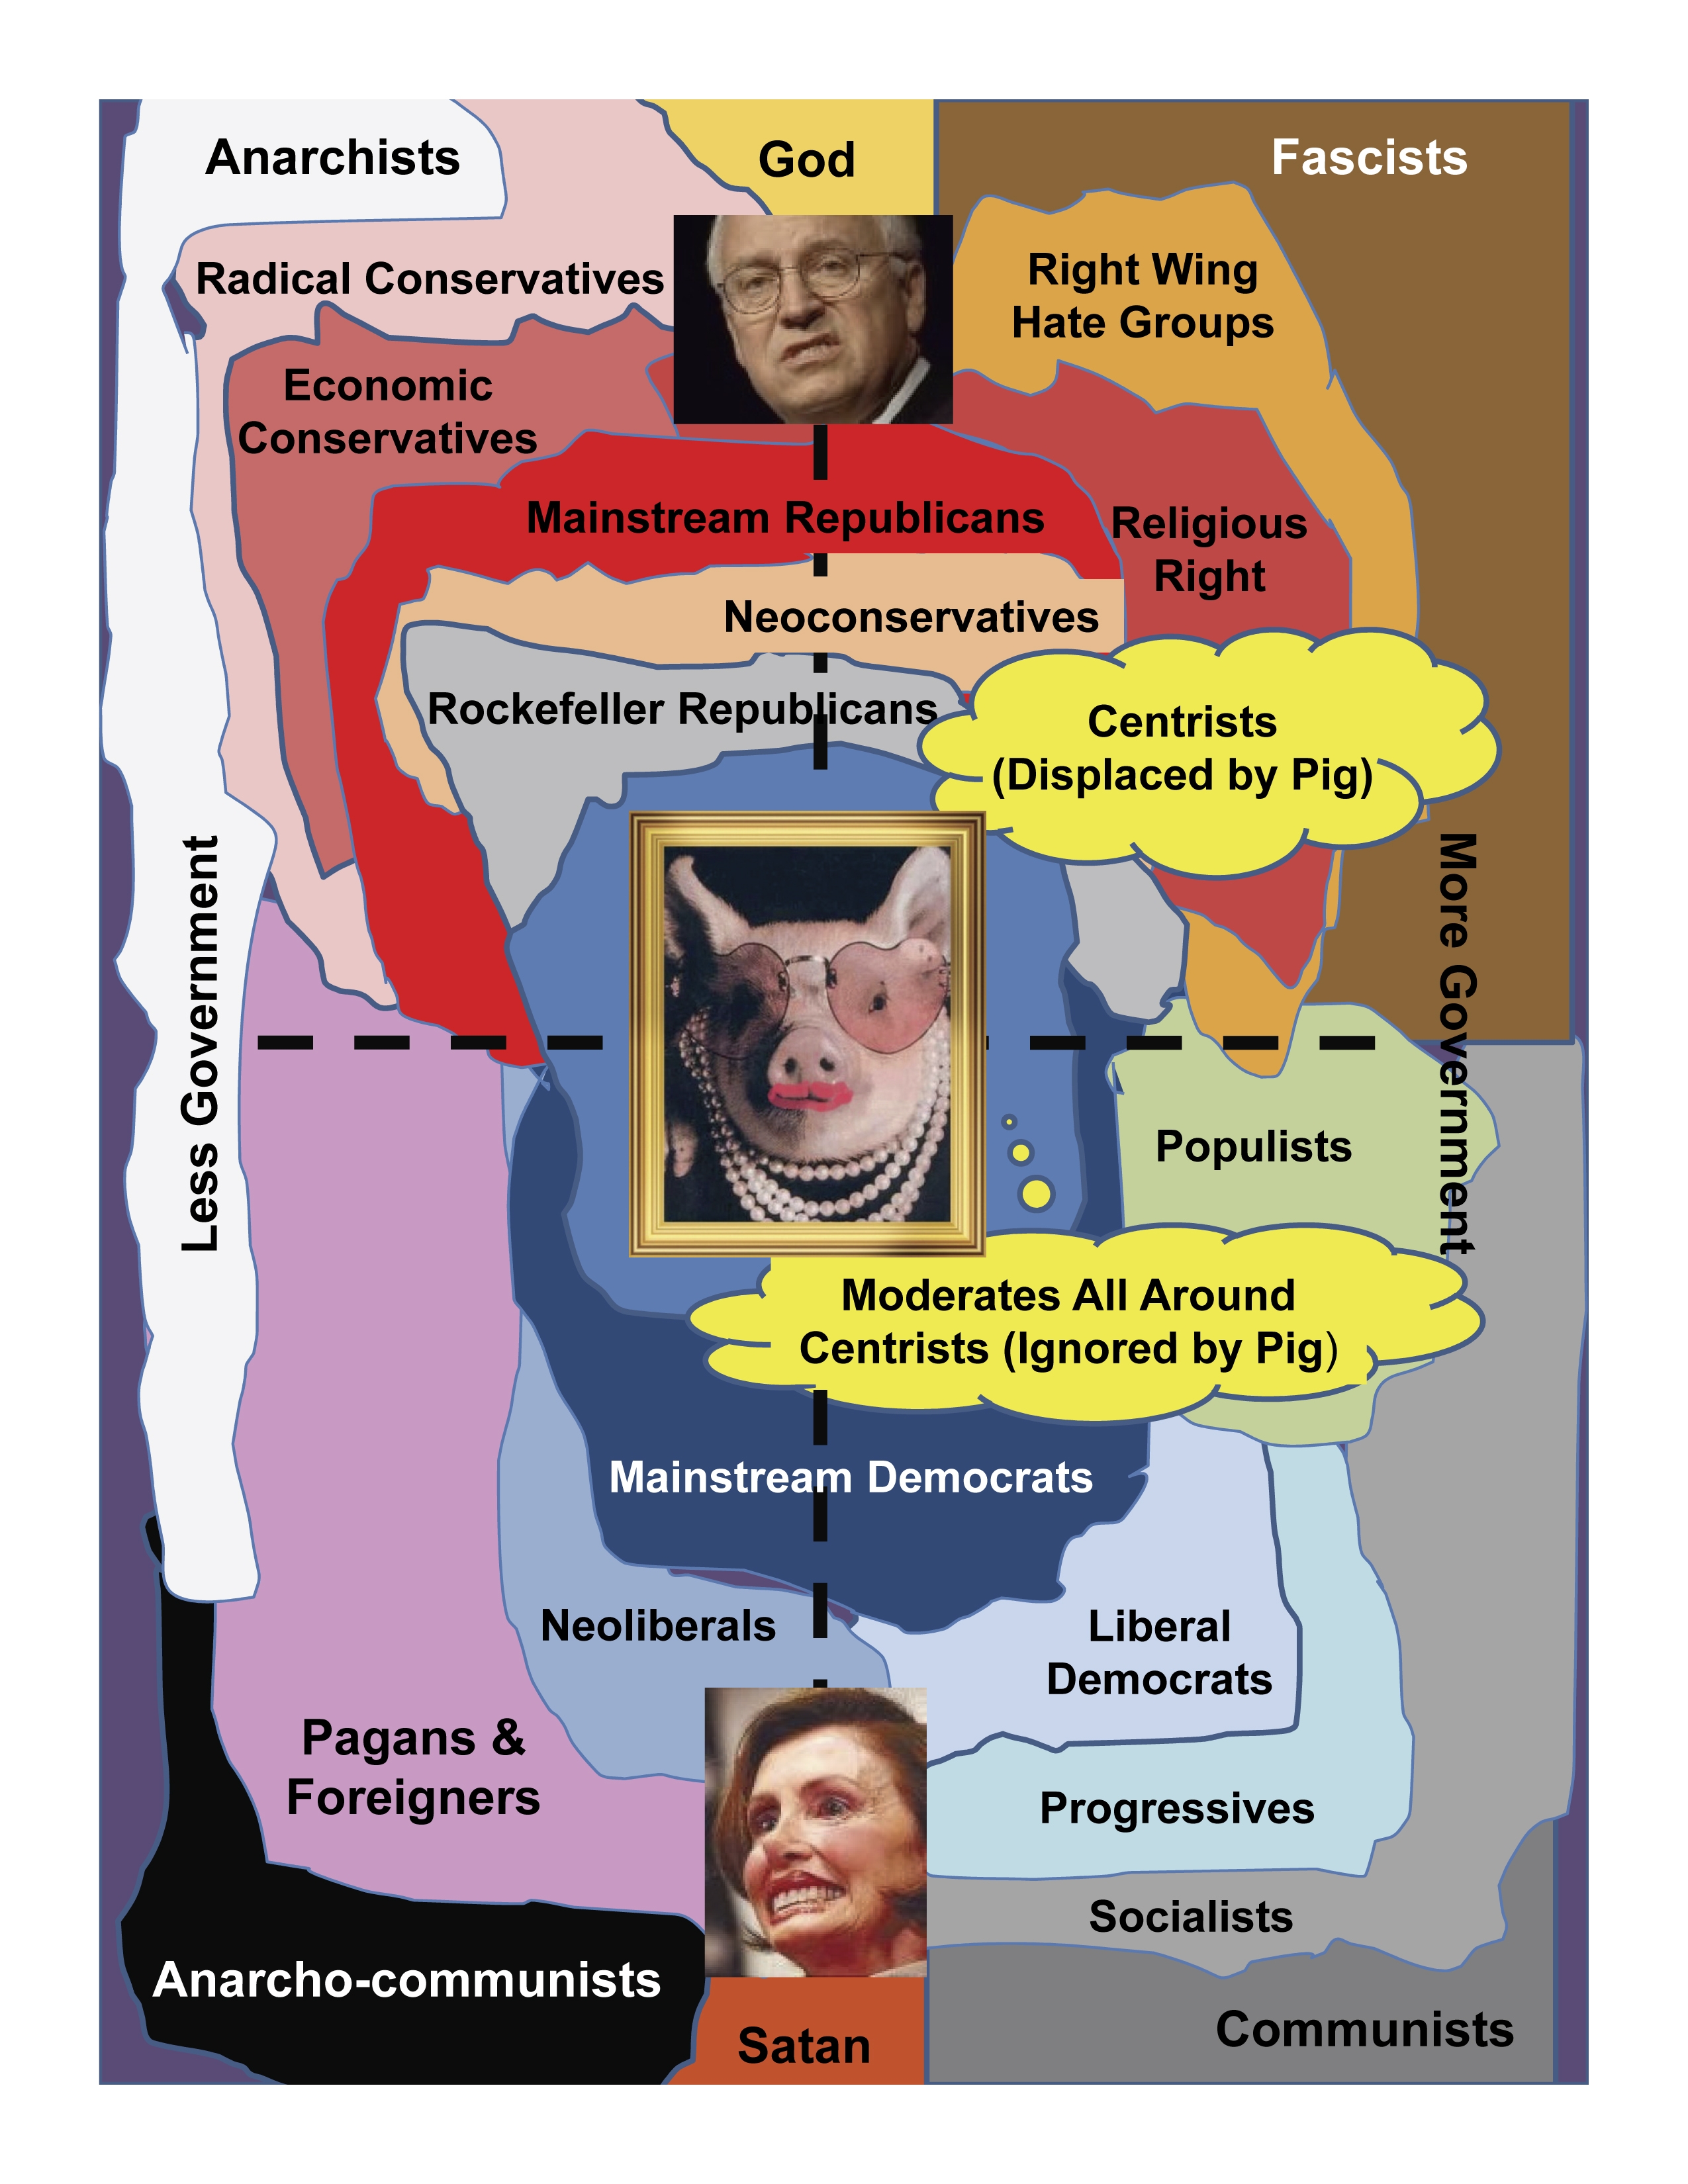
Graphic: Visualization of Left versus Right (False Gods)

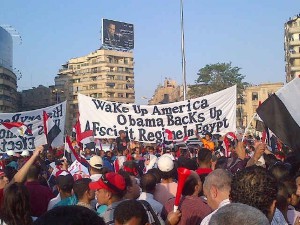
Graphic: Wake Up America — from the Middle East with Anger
Graphic: Water Wars (1990′s Depiction)

Graphic: Water-Centric Holistic Analysis

Graphic: Water and Cites–Urban Shortages

Graphic: Water Aquifers (Groundwater)

Graphic: Water Distribution, Water Wars

Graphic: Water Footprint Across Your Day…

Graphic: Water Stress & Biodiversity Threat

Graphic: Water Stress After Technology

Graphic: Water Stress (Global) in 2050

Graphic: Web of Fragmented Knowledge

Graphic: We the People Reform Coalition

Graphic: What Strategies & Policies Apply?
Graphic: What Threats Should We Consider?

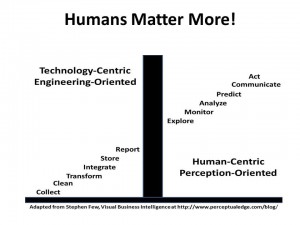
Graphic: When IT Hits the Wall and Only Humans Will Do


Graphic: White Space Phone (Nokia/Microsoft)

Graphic: Who Am I? Does It Matter?

Graphic: whole earth review cover ben franklin internet democracy

Graphic: Whole of Government Intelligence

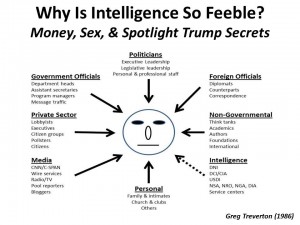
Graphic: Why Is Intelligence So Feeble?
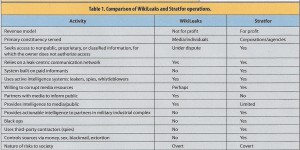
Graphic: WikiLeaks Good, STRATFOR Evil? A Documented Comparison
Graphic: World Brain Eight Core Sharing Functions

Graphic: World Map of [Radical] Islamism

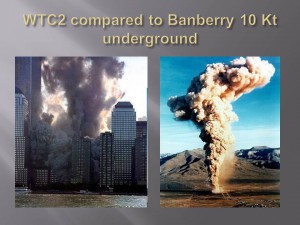
Graphic: WTC2 Plume Compared to Known Nuclear Plume
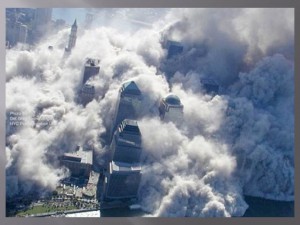
Graphic: WTC Debris and Dust Spread on 9/11
Graphic: Yoda Got Crowd at Hackers

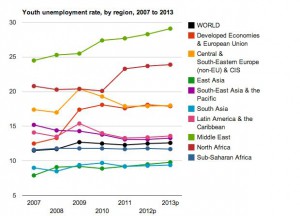
Graphic: Youth Unemployment by Region — Worst Ever
Graphic: Zero-Based “Clean Sheet” Needs Study

Journal: 20th Century Clunkers vs 21st Century Slims

Journal: Brains Beat Algorithms….Again

Journal: ClimateGate–”The Trick” Explained

Journal: Experimental Cultural Geography

Preconditions of Revolution in the USA Today
Real PR (public reality): Harsh Realities in “Call of Duty”
Reference: Citation Analytics 201

Reference: Conversational Leadership

Reference: Golden Candle Pins & Candle Holders

Reference: Maps of the Post Flood Future Geography

Reference: Religion, Science, & Philosophy

Reference: Remembering Laos and the Hmong

Reference: World Map of Social Networks

Robert Garigue & Robert Steele: From Old IO to New IO

Robert Garigue: Evolution of Cyber-Space

Robert Garigue: Feedback for Dynamic System Change

Robert Garigue: Information Security MANDATE

Robert Garigue: Role of the Chief Information Security Officer

Robert Garigue: Security as the Guarantor of Values Executed by Systems–Security as Truth & Trust

Robert Garigue: Security Services versus IT Processes

Robert Garigue: Standards Toward Interoperability

Robert Garigue: Strategic Evolution of Information Security

Robert Garigue: Structuring Risks (Role of Security)
")
Robert Garigue: The Next Long Wave of Innovation


Robert Garigue: Truth & Trust as Security Requirements

Robert Garigue: When Everything Else is Distributed….

Search & Worth a Look: Iraq Veteran Rings

Search: buckminster fuller map

Search: caliphate variant 100-year war

Search: current genocides 2012 maps

Search: Intelligence Community Wheel

Search: iranian ethnic structure

Search: pigs back [blue red pig butts]


Search: rescue network patches


Search: world map with 8 conflicts

Search: world map with conflict marked other maps
Multiple links, click on above.
Click to see seven most important graphics related to our mission.
Telegeography Global Traffic Map 2010 + Cell Phones & Cancer: New Report Sends Mixed Messages

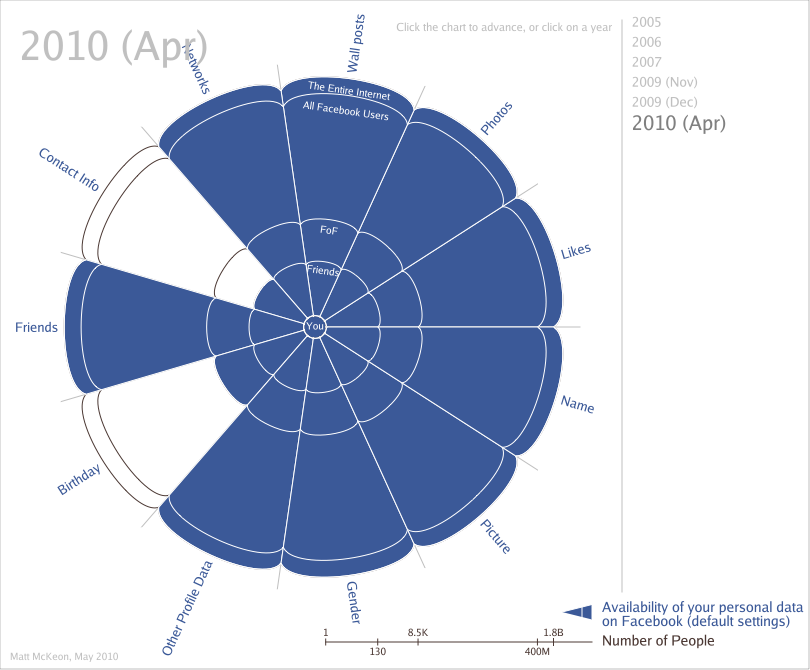
The Evolution of Privacy on Facebook: Changes in default profile settings over time
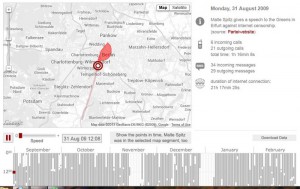
U.S. Geological Survey: Twitter Earthquake Detector (TED)
 Map")
Video: “Twinkie Deconstructed” Author Shows Strange Origins & Nexus of Ingredients


Worth a Look: War Is A Crime Goes After Dick Cheney

Worth a Look: Wealth-Generating Economies


