My (new) colleagues at the University of Chicago recently launched a new and exciting program called “Data Science for Social Good”. The program, which launches this summer, will bring together dozens top-notch data scientists, computer scientists an social scientists to address major social challenges. Advisors for this initiative include Eric Schmidt (Google), Raed Ghani (Obama Administration) and my very likable colleague Jake Porway (DataKind). Think of “Data Science for Social Good” as a “Code for America” but broader in scope and application. I’m excited to announce that QCRI is partnering with this important new program given the strong overlap with our Social Innovation Vision, Strategy and Projects.
Powerful and effective heuristics are the only way to quickly communicate the complex understandings required to save humanity, because they facilitate quick feedback. They break through information logjams. They reduce information overload. The various elite powers on the planet use heuristics in the form of propaganda to mislead the people and drive them like cattle toward a predetermined objective. But they have a great advantage over us. It's easier to confuse than enlighten. It's easier to destroy than to build. It's easier to get people to misunderstand complexity than to get them to understand it.
So unless we become clever at heuristics, we are outnumbered and outgunned. And we need to be cognizant of any model that can help us dilate the conduits of feedback to the point where our big picture understandings can spread like lightening to the general public. There are many ways to do this, mostly by commandeering well-understood terms and putting them to new uses.
While I was watching the Boston Marathon bombing coverage I heard them talk about victims who were at one point in critical condition but who had been reevaluated to serious condition. And it made me want to look up the precise definitions of these terms. That's when I saw that they could have usefulness describing all kinds of complex social dynamics. After all, that's what systems theory is all about. The five terms are: undetermined, good, fair, serious, and critical. You can find definitions here at wikipedia:
Briefly, they are: waiting assessment; stable within normal limits; indicators are favorable; indicators are questionable; and indicators are unfavorable. These concepts can be applied at every level and context of social dynamics because they are terms that describe systems. And as Donella H. Meadows stressed, the whole point of systems theory is to cut through all the jargon of the multiplicity of specialties. The point is to make things as simple as possible without making them too simple. Simplify but don't oversimplify.
When I was checking out the Think Tanks & Civil Societies Program I noticed e-International Relations – the world’s leading website for students of international politics. They had an About page similar to that of Wikistrat, listing all of their volunteer editors and some additional information on them.
Last night I entered most of that information into e-IR-base, a Maltego graph. Those who want to follow along can download the graph file, get the free Maltego Community Edition, and do a portion of the things I do with it. The free version has very limited access to Paterva‘s transform servers, so I will provide the necessary intermediate files.
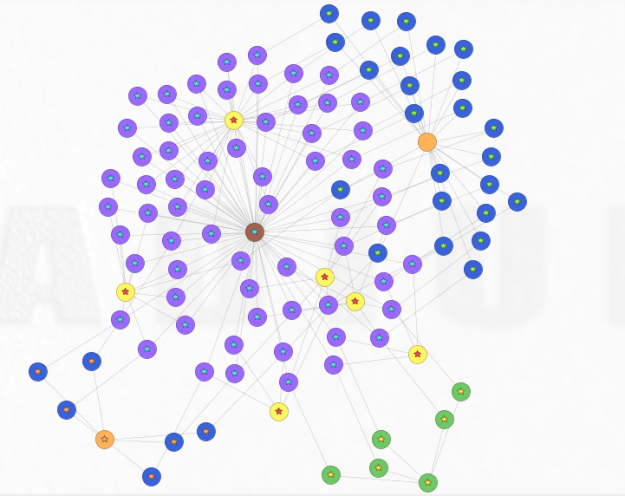
Click on Image to Enlarge
This is a top level view of the e-IR graph. What I say next presumes some knowledge of hands on work with Maltego.
The lavender dots are Person entities – a place for a first and last name, and like every entity you can makes notes and attach files to it. The blue dots at the upper right are URL entities and they contain links to an editor’s profile on the official site. Not everyone has a profile – this seems to be for people who produce their own content as well as work as editors. The five green dots are Twitter accounts, the five blue dots with an orange dot in the middle are LinkedIn profiles and an entity for the domain itself.
Maltego provides different types of entities, but here at the start we are only using Person, Domain, URL, and Phrase. Maltego provides a way to group different types of entities using colored stars – blue, green, yellow, orange, and red. This is useful for searching and organizing tasks – if you run a transform that starts with the five Twitter accounts shown here, but gets back over a thousand responses, how do you spot your originals?
Suggestions for process-oriented titles of global issue reports
EXTRACT
Given the increasingly disastrous “state of the world”, and that foreseen for the future, it is appropriate to ask whether another language might enable meaning to be carried otherwise — and potentially more imaginatively and fruitfully. There is clearly a fundamental problem with respect to the relationship between states of any kind — one which obscures consideration of the dynamics which may be vital to the essence of meaning. This is only too evident in the case of Israel-Palestine, India-Pakistan, North Korea-South Korea, and the like — as with the “two-state solutions” proposed in the first case.
. . . . . . . .
With respect to enhancing insight into the dynamic, a striking innovation in “turning statistics into knowledge” — with the slogan “unveiling the beauty of statistics for a fact based world” — has been offered by the Gapminder initiative, within the context of the OECD Global Project on Measuring the Progress of Societies. A provocatve case might however be made for re-imaging “statistics” — as exemplifying state language – with something akin to “dynastics”.
. . . . . . . .
It can be readily argued that this collection of “states” offers no indication of how they are interrelated systemically between the domains so thematically bounded. This systemic connectivity has been the primary preoccupation of the Encyclopedia of World Problems and Human Potential now accessible online.
Ariana Huffington: “the decision-makers are not acting in the best interests of the public”
Voice Over: “socio-economic evolution out of synch with natural evolution”
Joichi Ito: “frugal engineering happens in the absence of abundance”
Many good endeavors still working in silos. Sharing and cross fertilization not there yet.
Those who have been sideline by power now have ability to by-pass power and connect to all.
Published on Apr 10, 2013
What will the world look like in 50 years? The problems facing our world are so large that they demand disruptive thinking. We don't have time to think in incremental terms. It's time to challenge the status quo, and dare to imagine what we can do.
Generations of Eastern European housewives doing battle against bedbugs spread bean leaves around the floor of an infested room at night. In the morning, the leaves would be covered with bedbugs that had somehow been trapped there. The leaves, and the pests, were collected and burned — by the pound, in extreme infestations.
Prof. Robert Appleton of Ryerson University recently told me: “In most fields, the language [of communication] is still dominated by words and numbers.” I think he is right. Think about the daily routine in most organizations. We produce reports and strategy papers. We often forget to convey this knowledge into tangible pictures and stories.
Visualize Business Models
I bought the book Business Model Generation: A Handbook for Visionaries, Game Changers, and Challengers [72 slides free online at SlideShare] by Alexander Osterwalder. First, this book provides and easy understandable and visual approach for capturing the value and the implications of business models. This book is a useful “ready to use” tool to change the way in which you approach your work. Roger Martin, an advocate for design thinking in business says: “Businesspeople don’t just need to understand designers better – they need to become designers.”
Second, the book itself has a new business model. It is co-created by 470 practitioners.