My team and I at QCRI have just completed a detailed analysis of the 13,200+ tweets posted from one hour before the attacks began until two hours into the attack. The purpose of this study, which will be launched at CrisisMappers 2013 in Nairobi tomorrow, is to make sense of the Big (Crisis) Data generated during the first hours of the siege. A summary of our results are displayed below. The full results of our analysis and discussion of findings are available as a GoogleDoc and also PDF. The purpose of this public GoogleDoc is to solicit comments on our methodology so as to inform the next phase of our research. Indeed, our aim is to categorize and study the entire Westgate dataset in the coming months (730,000+ tweets). In the meantime, sincere appreciation go to my outstanding QCRI Research Assistants, Ms. Brittany Card and Ms. Justine MacKinnon for their hard work on the coding and analysis of the 13,200+ tweets. Our study builds on this preliminary review.
The following 7 figures summarize the main findings of our study. These are discussed in more detail in the GoogleDoc/PDF.
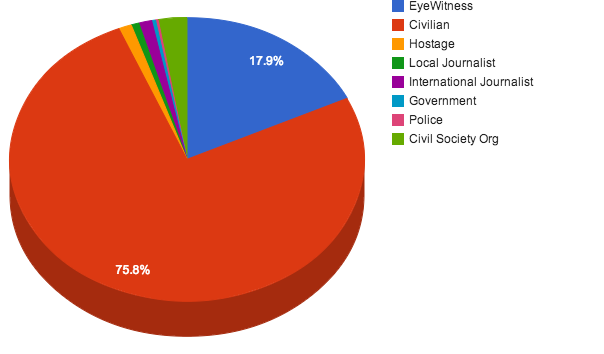
Figure 1: Who Authored the Most Tweets?
Figure 2: Frequency of Tweets by Eyewitnesses Over Time?
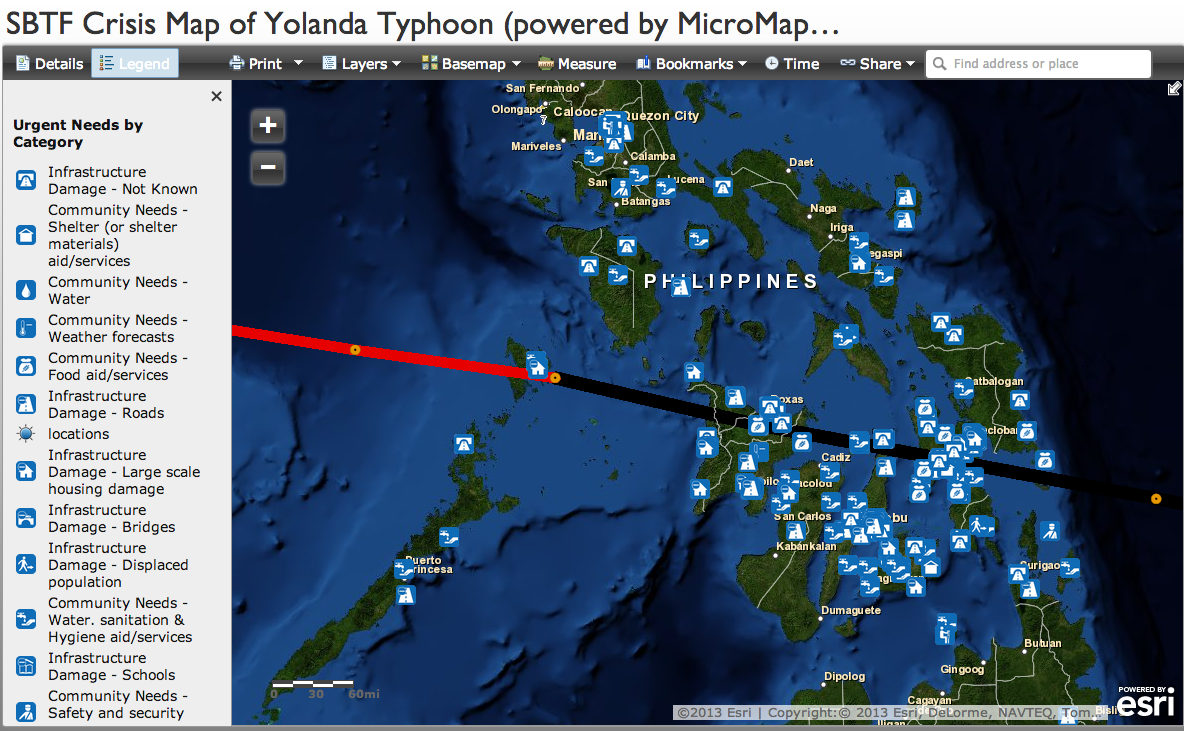
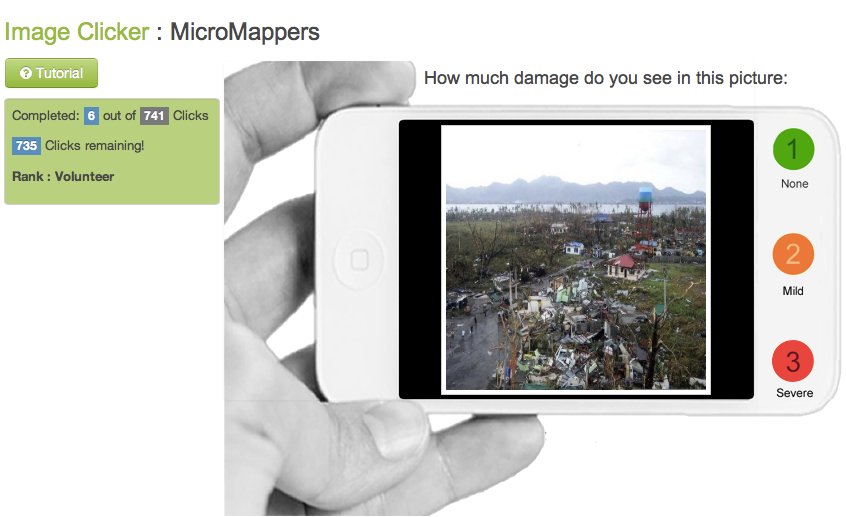
Digital humanitarian volunteers have been busing tagging images posted to social media in the aftermath of Typhoon Yolanda. More specifically, they’ve been using the new MicroMappers ImageClicker to rate the level of damage they see in each image. Thus far, they have clicked over 7,000 images. Those that are tagged as “Mild” and “Severe” damage are then geolocated by members of the Standby Volunteer Task Force (SBTF) who have partnered with GISCorps and ESRI to create this live Crisis Map of the disaster damage tagged using the ImageClicker. The map takes a few second to load, so please be patient.
The more pictures are clicked using the ImageClicker, the more populated this crisis map will become. So please help out if you have a few seconds to spare—that’s really all it takes to click an image. If there are no picture left to click or the system is temporarily offline, then please come back a while later as we’re uploading images around the clock. And feel free to join our list-serve in the meantime if you wish to be notified when humanitarian organizations need your help in the future. No prior experience or training necessary. Anyone who knows how to use a computer mouse can become a digital humanitarian.
The SBTF, GISCorps and ESRI are members of the Digital Humanitarian Network (DHN), which my colleague Andrej Verity and I co-founded last year. The DHN serves as the official interface for direct collaboration between traditional “brick-and-mortar” humanitarian organizations and highly skilled digital volunteer networks. The SBTF Yolanda Team, spearheaded by my colleague Justine Mackinnon, for example, has also produced this map based on the triangulated results of the TweetClicker:
There’s a lot of hype around the use of new technologies and social media for disaster response. So I want to be clear that our digital humanitarian operations in the Philippines have not been perfect. This means that we’re learning (a lot) by doing (a lot). Such is the nature of innovation. We don’t have the luxury of locking ourselves up in a lab for a year to build the ultimate humanitarian technology platform. This means we have to work extra, extra hard when deploying new platforms during major disasters—because not only do we do our very best to carry out Plan A, but we often have to carry out Plans B and C in parallel just in case Plan A doesn’t pan out. Perhaps Samuel Beckett summed it up best: “Ever tried. Ever failed. No matter. Try Again. Fail again. Fail better.”
We’ve been able to process and make sense of a quarter of a million tweets in the aftermath of Typhoon Yolanda. Using both AIDR (still under development) and Twitris, we were able to collect these tweets in real-time and use automated algorithms to filter for both relevancy and uniqueness. The resulting ~55,000 tweets were then uploaded to MicroMappers (still under development). Digital volunteers from the world over used this humanitarian technology platform to tag tweets and now images from the disaster (click image below to enlarge). At one point, volunteers tagged some 1,500 tweets in just 10 minutes. In parallel, we used machine learning classifiers to automatically identify tweets referring to both urgent needs and offers of help. In sum, the response to Typhoon Yolanda is the first to make full use of advanced computing, i.e., both human computing and machine computing to make sense of Big (Crisis) Data.
We’ve come a long way since the tragic Haiti Earthquake. There was no way we would’ve been able to pull off the above with the Ushahidi platform. We weren’t able to keep up with even a few thousand tweets a day back then, not to mention images. (Incidentally, MicroMappers can also be used to tag SMS). Furthermore, we had no trained volunteers on standby back when the quake struck. Today, not only do we have a highly experienced network of volunteers from the Standby Volunteer Task Force (SBTF) who serve as first (digital) responders, we also have an ecosystem of volunteers from the Digital Humanitarian Network (DHN). In the case of Typhoon Yolanda, we also had a formal partner, the UN Office for the Coordination of Humanitarian Affairs (OCHA), that officially requested digital humanitarian support. In other words, our efforts are directly in response to clearly articulated information needs. In contrast, the response to Haiti was “supply based” in that we simply pushed out all information that we figured might be of use to humanitarian responders. We did not have a formal partner from the humanitarian sector going into the Haiti operation.
What this new digital humanitarian operation makes clear is that preparedness, partnerships & appropriate humanitarian technology go a long way to ensuring that our efforts as digital humanitarians add value to the field-based operations in disaster zones. The above Prezi by SBTF co-founder Anahi (click on the image to launch the presentation) gives an excellent overview of how these digital humanitarian efforts are being coordinated in response to Yolanda.
While there are many differences between the digital response to Haiti and Yolanda, several key similarities have also emerged. First, neither was perfect, meaning that we learned a lot in both deployments; taking a few steps forward, then a few steps back. Such is the path of innovation, learning by doing. Second, like our use of Skype in Haiti, there’s no way we could do this digital response work without Skype. Third, our operations were affected by telecommunications going offline in the hardest hit areas. We saw an 18.7% drop in relevant tweets on Saturday compared to the day before, for example. Fourth, while the (very) new technologies we are deploying are promising, they are still under development and have a long way to go. Fifth, the biggest heroes in response to Haiti were the volunteers—both from the Haitian Diaspora and beyond. The same is true of Yolanda, with hundreds of volunteers from the world over (including the Philippines and the Diaspora) mobilizing online to offer assistance.
A Filipino humanitarian worker in Quezon City, Philippines, for example, is volunteering her time on MicroMappers. As is customer care advisor from Eurostar in the UK and a fire officer from Belgium who recruited his uniformed colleagues to join the clicking. We have other volunteer Clickers from Makati (Philippines), Cape Town (South Africa), Canberra & Gold Coast (Australia), Berkeley, Brooklyn, Citrus Heights & Hinesburg (US), Kamloops (Canada), Paris & Marcoussis (France), Geneva (Switzerland), Sevilla (Spain), Den Haag (Holland), Munich (Germany) and Stokkermarke (Denmark) to name just a few! So this is as much a human story is it is one about technology. This is why online communities like MicroMappers are important. So please join our list-serve if you want to be notified when humanitarian organizations need your help.
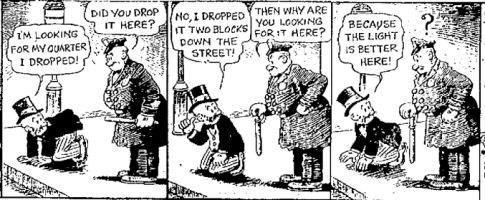
A police officer sees a man searching for his coin under a streetlight. After helping for several minutes, the exasperated officer asks if the man is sure that he lost his coin there. The man says “No, I lost them in the park a few blocks down the street.” The incredulous officer asks why he’s searching under the streetlight. The man replies, “Well this is where the light is.”[1] This parable describes the “streetlight effect,” the observational bias that results from using the easiest way to collect information. The streetlight effect is an important criticisms leveled against the use of social media for emergency management. This certainly is a valid concern but one that needs to be placed into context.
I had the honor of speaking on a UN panel with Hans Rosling in New York last year. During the Q&A, Hans showed Member States a map of cell phone coverage in the Democratic Republic of the Congo (DRC). The map was striking. Barely 10% of the country seemed to have coverage. This one map shut down the entire conversation about the value of mobile technology for data collection during disasters. Now, what Hans didn’t show was a map of the DRC’s population distribution, which reveals that the majority of the country’s population lives in urban areas; areas that have cell phone coverage. Hans’s map was also static and thus did not convey the fact that the number cell phone subscribers increased by roughly 50% in the year leading up to the panel and ~50% again the year after.
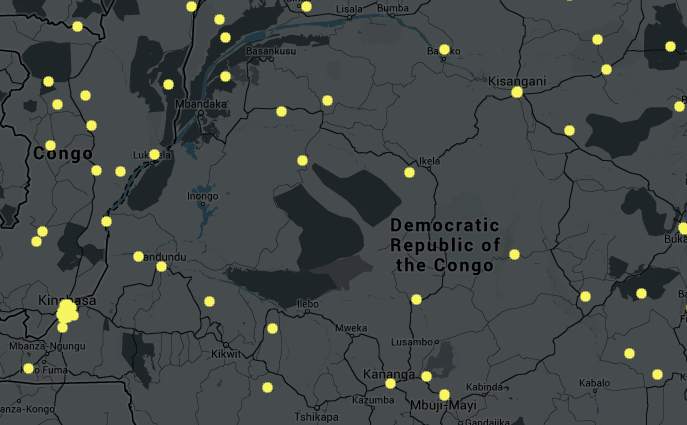
Of course, the number of social media users in the DRC is far, far lower than the country’s 12.4 million unique cell phone subscribers. The map below, for example, shows the location of Twitter users over a 10 day period in October 2013. Now keep in mind that only 2% of users actually geo-tag their tweets. Also, as my colleague Kalev Leetaru recently discovered, the correlation between the location of Twitter users and access to electricity is very high, which means that every place on Earth that is electrified has a high probability of having some level of Twitter activity. Furthermore, Twitter was only launched 7 years ago compared to the first cell phone, which was built 30 years ago. So these are still early days for Twitter. But that doesn’t change the fact that there is clearly very little Twitter traffic in the DRC today. And just like the man in the parable above, we only have access to answers where an “electrified tweet” exists (if we restrict ourselves to the Twitter streetlight).
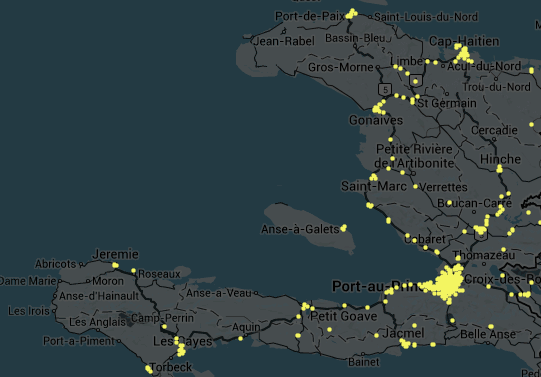
But this begs the following question, which is almost always overlooked: too little traffic for what? This study by Harvard colleagues, for example, found that Twitter was faster (and as accurate) as official sources at detecting the start and early progress of Cholera after the 2010 earthquake. And yet, the corresponding Twitter map of Haiti does not show significantly more activity than the DRC map over the same 10-day period. Keep in mind there were far fewer Twitter users in Haiti four years ago (i.e., before the earthquake). Other researchers have recently shown that “micro-crises” can also be detected via Twitter even though said crises elicit very few tweets by definition. More on that here.
But why limit ourselves to the Twitter streetlight? Only a handful of “puzzle pieces” in our Haiti jigsaw may be tweets, but that doesn’t mean they can’t complement other pieces taken from traditional datasets and even other social media channels. Remember that there are five times more Facebook users than Twitter users. In certain contexts, however, social media may be of zero added value. I’ve reiterated this point again in recent talks at the Council on Foreign Relation and the UN. Social media is forming a new “nervous system” for our planet, but one that is still very young, even premature in places and certainly imperfect in representation. Then again, so was 911 in the 1970′s and 1980′s as explained here. In any event, focusing on more developed parts of the system (like Indonesia’s Twitter footprint below) makes more sense for some questions, as does complementing this new nervous system with other more mature data sources such mainstream media via as GDELT as advocated here.
“Arguing that Big Data isn’t all it’s cracked up to be is a straw man, pure and simple—because no one should think it’s magic to begin with.” Since citing this point in my previous post on Big Data for Disaster Response: A List of Wrong Assumptions, I’ve come across more mischaracterizations of Big (Crisis) Data. Most of these fallacies originate from the Ivory Towers; from social scientists who have carried out one or two studies on the use of social media during disasters and repeat their findings ad nauseam as if their conclusions are the final word on a very new area of research.
The mischaracterization of “Big Data and Sample Bias”, for example, typically arises when academics point out that marginalized communities do not have access to social media. First things first: I highly recommend reading “Big Data and Its Exclusions,” published by Stanford Law Review. While the piece does not address Big Crisis Data, it is nevertheless instructive when thinking about social media for emergency management. Secondly, identifying who “speaks” (and who does not speak) on social media during humanitarian crises is of course imperative, but that’s exactly why the argument about sample bias is such a straw man—all of my humanitarian colleagues know full well that social media reports are not representative. They live in the real world where the vast majority of data they have access to is unrepresentative and imperfect—hence the importance of drawing on as many sources as possible, including social media. Random sampling during disasters is a Quixotic luxury, which explains why humanitarian colleagues seek “good enough” data and methods.
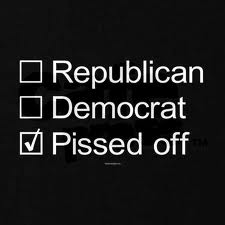
It’s not exactly a vote of confidence in the powers that be: A sizable number of Americans think the undead would do a better job than our Representatives in Washington, D.C.
Americans ages 18 to 64 express slightly more confidence in zombies to run things than in the federal government. Seniors have more faith in the government.
Do over-the-top political attack ads work?
The political advertising cycle is about to heat up again and outrageous attack ads are already hitting the airwaves. A new political advertisement attacking San Diego mayoral candidate Nathan Fletcher is raising eyebrows because it is from a political action committee: Zombies for Responsible Government:
Published reports said the documents filed with the San Diego City Clerk show the group was registered by David Bauer, a treasurer with the conservative Sacramento Valley Lincoln Club. However, those documents are not clear as to who is really behind the group.
Swarm Management: In many ways, success can be harder to handle than failure, because it sets expectations most people have never felt. These are some of the most important experiences on how to not make a wild success crash on its maiden flight into a painful failure.