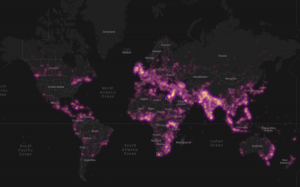
Global Heat Map of Protests in 2013
My colleague Kalev Leetaru recently launched GDELT (Global Data on Events, Location and Tone), which includes over 250 million events ranging from riots and protests to diplomatic exchanges and peace appeals. The data is based on dozens of news sources such as AFP, AP, BBC, UPI, Washington Post, New York Times and all national & international news from Google News. Given the recent wave of protests in Cairo and Istanbul, a collaborator of Kalev’s, John Beieler, just produced this digital dynamic map of protests events thus far in 2013. John left out the US because “it was a shining beacon of protest activity that distracted from the other parts of the map.”
Read full article with multiple graphics.

Phi Beta Iota: This is a spectacular taste of the future world dashboard where all threats and all policies and all costs can be displayed in near real time. What the humanitarian technical innovators are doing is what government should have been doing for the past two decades.
See Also:
1976-2013: Analytic, Methodological, & Technical Models 2.1
Worth a Look: 1989 All-Source Fusion Analytic Workstation–The Four Requirements Documents


