Analysis of Multimedia Shared on Twitter After Tornado
Humanitarian organizations and emergency management offices are increasingly interested in capturing multimedia content shared on social media during crises. Last year, the UN Office for the Coordination of Humanitarian Affairs (OCHA) activated the Digital Humanitarian Network (DHN) to identify and geotag pictures and videos shared on Twitter that captured the damage caused by Typhoon Pablo, for example. So I’ve been collaborating closely with my colleague Hemant Purohit to analyze the multimedia content shared by millions of tweets posted after the Category 5 Tornado devastated the city of Moore, Oklahoma on May 20th. The results are shared below along with details of a project I am spearheading at QCRI to provide disaster responders with relevant multimedia content in real time during future disasters.

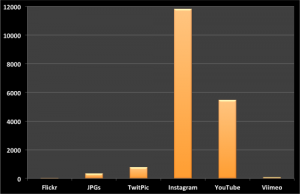
For this preliminary multimedia analysis, we focused on the first 48 hours after the Tornado and specifically on the following multimedia sources/types: Twitpic, Instagram, Flickr, JPGs, YouTube and Vimeo. JPGs refers to URLs shared on Twitter that include “.jpg”. Only ~1% of tweets posted during the 2-day period included URLs to multimedia content. We filtered out duplicate URLs to produce the following unique counts depicted above and listed below.
- Twitpic = 784
- Instagram = 11,822
- Flickr = 33
- JPGs = 347
- YouTube = 5,474
- Vimeo = 88
Clearly, Instagram and Youtube are important sources of multimedia content during disasters. The graphs below (click to enlarge) depict the frequency of individual multimedia types by hour during the first 48 hours after the Tornado. Note that we were only able to collect about 2 million tweets during this period using the Twitter Streaming API but expect that millions more were posted, which is why access to the Twitter Firehose is important and why I’m a strong advocate of Big Data Philanthropy for Humanitarian Response.
Read full post with more graphs.


