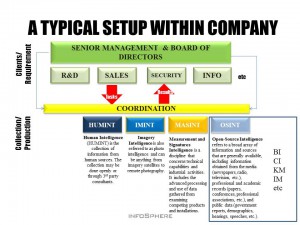
Graphic: OSINT by InfoSphere (Company)

Capabilities-Force Structure, Collection, Graphics, ICT-IT, Innovation, Processing, Strategy-Holistic Coherence, Tribes
Click on Image to Enlarge

Source: Email from CEO of InfoSphere SA (SE)

InfoSphere CEO Comment:  We never talk OSINT.. We talk sourceinfo. This is the Infosphere view.   Remote is what you do with your computer, phone, etc.  Direct is when you collect on the ground.  Covert or Overt – lines are blurry.  The output is intelligence, the input data and information.   We argue that HUMOSI SIGOSI, etc is a part of the game.  When you monitor social media like twitter  or look into a facebook profile with a fake profile –is that HUM or SIG or OSI  Intelligence is defined by the output… 

Phi Beta Iota:  We include HUMINT-acquired handheld video and photos in IMINT, and we have a separate SIGINT column for HUMINT-enabled close-in SIGINT, but generally speaking this slide and the capabilities it represents are “best in class.”  InfoSphere remains the only commercial intelligence provider we take seriously.  Everyone else has practical, intellectual, ethical, or financial issues that in our view render less than full scope.  Most governments do not do OSINT, they have an open source dribble into all-source that is largely comatose, the Nordics and Netherlands being the exceptions.  InfoSphere SA is also the only company we have found that is truly able, over the past decade, to BOTH place people on the ground in any of 33 languages within 24-72 hours AND properly process, visualize, and deliver the full spectrum collection in an actionable form understandable by a consumer with a three color mind-set (red, yellow, green).  See Also:  SiloBreaker (search and analytics tool both free and for fee).

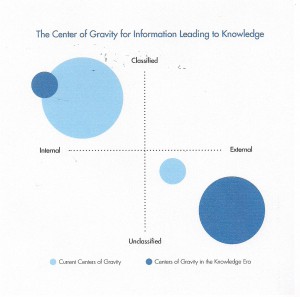
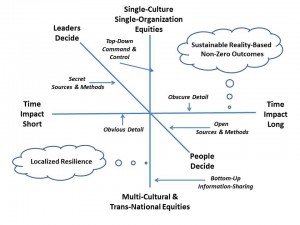
Graphic: Changing Centers of Gravity for Intelligence in an Open World

Balance, Capabilities-Force Structure, Collection, Graphics, ICT-IT, Processing
Click on Image to Enlarge

Source Page 11

Steele-Wright Commentary on Source with Graphics

Click on Image to Enlarge

See Also:

2011 Open Source Agency: Executive Access Point

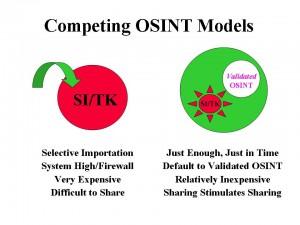
Graphic: OSINT Competing Models

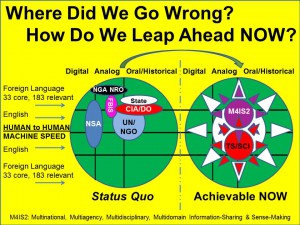
Graphic: OSINT, We Went Wrong, Leaping Forward

Books on Intelligence & Information Operations by Robert David STEELE Vivas et al

Click on Image to Enlarge

Reference: Human Intelligence (HUMINT) – All Humans, All Minds, All the Time [Full Text Online for Google Translate]

Review: No More Secrets – Open Source Information and the Reshaping of U.S. Intelligence

Review: Open Source Intelligence in a Networked World

Search: osint models

Who’s Who in Collective Intelligence: Robert David STEELE Vivas

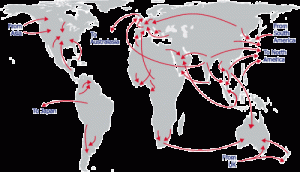
Patrick Meier: Using E-Mail Data to Estimate International Migration Rates

Citizen-Centered, Geospatial, Geospatial
Patrick Meier

Using E-Mail Data to Estimate International Migration Rates

As is well known, “estimates of demographic flows are inexistent, outdated, or largely inconsistent, for most countries.” I would add costly to that list as well. So my QCRI colleague Ingmar Weber co-authored a very interesting study on the use of e-mail data to estimate international migration rates.

The study a large sample of Yahoo! emails sent by 43 million users between September 2009 and June 2011. “For each message, we know the date when it was sent and the geographic location from where it was sent. In addition, we could link the message with the person who sent it, and with the user’s demographic information (date of birth and gender), that was self reported when he or she signed up for a Yahoo! account. We estimated the geographic location from where each email message was sent using the IP address of the user.”

Click on Image to Enlarge

The authors used data on existing migration rates for a dozen countries and international statistics on Internet diffusion rates by age and gender in order to correct for selection bias. For example, “estimated number of migrants, by age group and gender, is multiplied by a correction factor to adjust for over-representation of more educated and mobile people in groups for which the Internet penetration is low.” The graphs below are estimates of age and gender-specific immigration rates for the Philippines. “The gray area represents the size of the bias correction.” This means that “without any correction for bias, the point estimates would be at the upper end of the gray area.” These methods “correct for the fact that the group of users in the sample, although very large, is not representative of the entire population.”

Continue reading “Patrick Meier: Using E-Mail Data to Estimate International Migration Rates”

Graphic: UN 0 Cost of Peace vs. Cost of War

Analysis, Balance, Budgets & Funding, Graphics, Leadership-Integrity, Multinational Plus, Policies-Harmonization, Political, Reform, Strategy-Holistic Coherence, True Cost, United Nations
US20B End Starvation & Malnutrition US17B Safety for All
US12B Clean Water for All US30B Retire Debt/Credit for All
US23B Health Care for All US45B Energy for All (Clean, Safe)
US21B Shelter for All US11B Population Stabilization for All
US10B Education for All US12B Democracy & Diversity for All
TOTAL FOR PEACE:  US201B/Year TOTAL NOW FOR WAR: US1T/Year

Source Figure 1

See Also:

Graphic: Medard Gabel’s Cost of Peace versus War