Patrick Meier: What is Big (Crisis) Data? How Do You Reduce Relevant Mass? Human Solutions to Machine Filter Failure

Crowd-Sourcing, Design, Geospatial
Patrick Meier
Patrick Meier

What is Big (Crisis) Data?

What does Big Data mean in the context of disaster response? Big (Crisis) Data refers to the relatively large volumevelocity and variety of digital information that may improve sense making and situational awareness during disasters. This is often referred to the 3 V’s of Big Data.

Volume refers to the amount of data (20 million tweets were posted during Hurricane Sandy) while Velocity refers to the speed at which that data is generated (over 2,000 tweets per second were generated following the Japan Earthquake & Tsunami). Variety refers to the variety of data generated, e.g., Numerical (GPS coordinates), Textual (SMS), Audio (phone calls), Photographic (satellite Imagery) and Video-graphic (YouTube). Sources of Big Crisis Data thus include both public and private sources such images posted as social media (Instagram) on the one hand, and emails or phone calls (Call Record Data) on the other. Big Crisis Data also relates to both raw data (the text of individual Facebook updates) as well as meta-data (the time and place those updates were posted, for example).

Ultimately, Big Data describe datasets that are too large to be effectively and quickly computed on your average desktop or laptop. In other words, Big Data is relative to the computing power—the filters—at your finger tips (along with the skills necessary to apply that computing power). Put differently, Big Data is “Big” because of filter failure. If we had more powerful filters, said “Big” Data would be easier to manage. As mentioned in previous blog posts, these filters can be created using Human Computing (crowdsourcing, microtasking) and/or Machine Computing (natural language processing, machine learning, etc.).

Click on Image to Enlarge

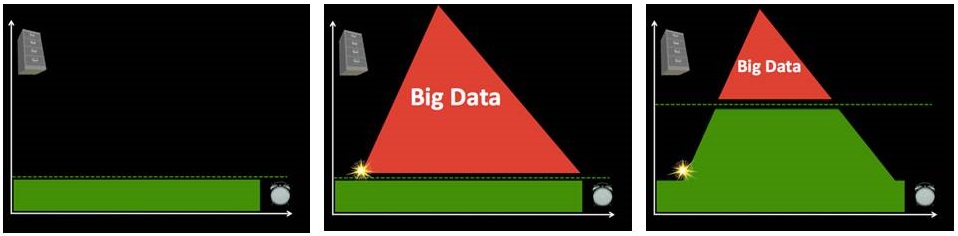
Take the [first] graph, for example. The horizontal axis represents time while the vertical one represents volume of information. On a good day, i.e., when there are no major disasters, the Digital Operations Center of the American Red Cross monitors and manually reads about 5,000 tweets. This “steady state” volume and velocity of data is represented by the green area. The dotted line just above denotes an organization’s (or individual’s) capacity to manage a given volume, velocity and variety of data. When disaster strikes, that capacity is stretched and often overwhelmed. More than 3 million tweets were posted during the first 48 hours after the Category 5 Tornado devastated Moore, Oklahoma, for example. What happens next is depicted in the [second] graph below.

Humanitarian and emergency management organizations often lack the internal surge capacity to manage the rapid increase in data generated during disasters. This Big Crisis Data is represented by the red area. But the dotted line can be raised. One way to do so is by building better filters (using Human and/or Machine Computing). Real world examples of Human and Machine Computing used for disaster response are highlighted here and here respectively.

A second way to shift the dotted line is with enlightened leadership [third graphic]. An example is the Filipino Government’s actions during the recent Typhoon. More on policy here. Both strategies (advanced computing & strategic policies) are necessary to raise that dotted line in a consistent manner.

See also:

  • Big Data for Disaster Response: A List of Wrong Assumptions [Link]

Jean Lievens: SHARING Culture and Economy in the Internet Age

Design, Economics/True Cost, P2P / Panarchy
Jean Lievens
Jean Lievens

This site hosts the augmented edition of Sharing: Culture and the Economy in the Internet Age, a book by Philippe Aigrain, with the contribution of Suzanne Aigrain, published at Amsterdam University Press on February 1st, 2012 as a paper book and as an open access digital monograph. On this site, you can access the source code and datasets used in the book, comment on each of the book chapters, run our economic models for the financing of a sharing-compatible culture with your choice of parameters, and run our diversity of attention analysis software on your own datasets.

Publisher and US distributor presentations

Amazon Page
Amazon Page

In the past fifteen years, file sharing of digital cultural works between individuals has been at the center of a number of debates on the future of culture itself. To some, sharing constitutes piracy, to be fought against and eradicated. Others see it as unavoidable, and table proposals to compensate for its harmful effects. Meanwhile, little progress has been made towards addressing the real challenges facing culture in a digital world.

Sharing starts from a radically different viewpoint, namely that the non-market sharing of digital works is both legitimate and useful. It supports this premise with empirical research, demonstrating that non-market sharing leads to more diversity in the attention given to various works. Taking stock of what we have learnt about the cultural economy in recent years, Sharing sets out the conditions necessary for valuable cultural functions to remain sustainable in this context.

An in-depth exploration of digital culture and its dissemination, Sharing offers a counterpoint to the dominant view that file sharing is piracy. Instead, Philippe Aigrain looks at the benefits of file sharing, which allows unknown writers and artists to be appreciated more easily. Concentrating not only on the cultural enrichment caused by widely shared digital media, Sharing also discusses new financing models that would allow works to be shared freely by individuals without aim at profit. Aigrain carefully balances the needs to support and reward creative activity with a suitable respect for the cultural common good and proposes a new interpretation of the digital landscape.

About the authors

Philippe Aigrain is the CEO of Sopinspace – Society for Public Information Spaces and one of the founders of La Quadrature du Net. He previously authored Cause commune: l'information entre bien commun et propriété, Fayard, 2005.

Suzanne Aigrain is lecturer in astrophysics at Oxford University and a fellow of All Souls College.

Berto Jongman: Hans Rosling on Future Energy and Why Two Billion Poorest Matter

05 Energy, 06 Family, 07 Health, Design, Governance
Berto Jongman
Berto Jongman

Hans Rosling Illustrates Future Energy Consumption with Legos

by Big Think Editors

June 25, 2013, 3:01 PM

Here is the most low-tech explanation you will see on population growth, infant mortality and energy consumption, courtesy of the Swedish professor of global health, Hans Rosling. In the video below, Rosling makes strikingly clear through his lego demonstration that sustainable growth is only possible if we raise the living standards of the bottom two billion.

While the solution to this problem is elusive, there are few illustrations that you will find that present this global challenge in such clear terms as this video.

YouTube (3:18)

Berto Jongman: Security for the Internet of Things — Cars Can Be Hijacked and Used to Murder People — This Matters

Software
Berto Jongman
Berto Jongman

Rethinking Security for the Internet of Things

by Chris Clearfield

Harvard Business Review, June 26, 2013

Cyber attacks, once primarily directed against networks to steal confidential information and wreak virtual havoc, have begun to expand and are now directly affecting the physical world. For example, the recent hacking of the Associated Press's Twitter account by the Syrian Electronic Army and subsequent tweet about an explosion at the White House caused the U.S. stock market to decline almost 1% before the news was revealed as a hoax. In 2010 the computer worm Stuxnet was discovered and implicated in the attack that caused physical damage to centrifuges at Iranian nuclear enrichment facilities. In 2012 a hacker built and revealed a simple device that can open Onity-brand electronic locks (which secure over 4 million hotel room doors) without a key.

The growing Internet of Things — the connection of physical devices to the internet — will rapidly expand the number of connected devices integrated into our everyday lives. From connected cars, iPhone-controlled locks (versions of which here, here, and here are in or close to production), to the hypothetical “smart fridge” that will one day order milk for me when I've run out, these technologies bring with them the promise of energy efficiency, convenience, and flexibility. They also have the potential to allow cyber attackers into the physical world in which we live as they seize on security holes in these new systems.

Continue reading “Berto Jongman: Security for the Internet of Things — Cars Can Be Hijacked and Used to Murder People — This Matters”

Patrick Meier: Analyzing Foursquare Check-Ins During Hurricane Sandy — Coment on Why Free Cell Phones for the Five Billion Poor Needed

Crowd-Sourcing, Geospatial, Resilience
Patrick Meier
Patrick Meier

“When rare events at the scale of Hurricane Sandy happen, we expect them to leave an unquestionable mark on Social Media activity.” So the authors applied the same methods used to produce the above graph to visualize and understand changes in behavior during Hurricane Sandy as reflected on Foursquare and Twitter. The results are displayed below .

Click on Image to Enlarge

“Prior to the storm, activity is relatively normal with the exception of iMac release on 10/25. The big spikes in divergent activity in the two days right before the storm correspond with emergency preparations and the spike in nightlife activity follows the ‘celebrations’ pattern afterwards. In the category of Grocery shopping (top panel) the deviations on Foursqaure and Twitter overlap closely, while on Nightlife the Twitter activity lags after Foursquare. On October 29 and 30 shops were mostly closed in NYC and we observe fewer checkins than usual, but interestingly more tweets about shopping. This finding suggests that opposing patterns of deviations may indicate of severe distress or abnormality, with the two platforms corroborating an alert.”

Click on Image to Enlarge

In sum, “the deviations in the case study of Hurricane Sandy clearly separate normal and abnormal times. In some cases the deviations on both platforms closely overlap, while in others some time lag (or even opposite trend) is evident. Moreover, during the height of the storm Foursquare activity diminishes significantly, while Twitter activity is on the rise. These findings have immediate implications for event detection systems, both in combining multiple sources of information and in using them to improving overall accuracy.”

Now if only this applied research could be transfered to operational use via a real-time dashboard, then this could actually make a difference for emergency responders and humanitarian organizations. See my recent post on the cognitive mismatch between computing research and social good needs.

Continue reading “Patrick Meier: Analyzing Foursquare Check-Ins During Hurricane Sandy — Coment on Why Free Cell Phones for the Five Billion Poor Needed”

Jean Lievins: The Networked Society — DISRUPTIVE Technology Rules — and the Most Disruptive of All Technologies is C4ISR Technology that is Also Open Source

Architecture, Cloud, Culture, Design, Innovation, Knowledge, P2P / Panarchy, Resilience, Security
Jean Lievens
Jean Lievens

It’s about doing the impossible – faster

Technology is transforming how everybody builds solutions and faster access to the latest technology gives you an unfair advantage. I work in Silicon Valley and we benefit from that unfair advantage. This is because the technology being invented here is not incremental but disruptive.

EXTRACT:

You will notice the inclusion of Guardtime signatures. By signing all objects with Guardtime signatures it means we no longer have to trust the cloud provider – another game changer! A technology that scales so well it has been included in rysylog.

More background on the accelerating pace of change:
Changing the game
Winning the game

Continue reading “Jean Lievins: The Networked Society — DISRUPTIVE Technology Rules — and the Most Disruptive of All Technologies is C4ISR Technology that is Also Open Source”

Neal Rauhauser: Curator Skill Sheet — Future of Public Intelligence from the Bottom Up

Crowd-Sourcing, Governance, Innovation, Knowledge, P2P / Panarchy, Transparency
Neal Rauhauser
Neal Rauhauser

Compiled this from the source document:

Curator Types
•  Aggregator
•  Distiller
•  Elevator
•  Masher
•  Chronologist

Curator Skills
•  Sense-making: the ability to determine significance
•  Social intelligence: the ability to connect with others in a deep way
•  Adaptive thinking: the ability to come up with novel solutions
•  Cross-cultural competency: the ability to operate in new contexts
•  Computational thinking: ability to think abstractly and make data-driven decisions
•  New media literacy: the ability to assess new media critically and use itappropriately
•  Transdisciplinarity: ability to understand concepts across a range of disciplines
•  Design mindset: the ability to understand how the physical environment impactsthinking and make conscious choices in using it
•  Cognitive load management: the ability to filter information
•  Virtual collaboration: the ability to be a productive part of a virtual team

Curator Methods
•  Optimizes
•  Edits
•  Formats
•  Selects
•  Excerpts
•  Writes
•  Classifies
•  Links
•  Personalizes
•  Vets
•  Credits
•  Filters
•  Taps
•  Suggests
•  Searches
•  Scouts
•  Hacks Filters & Searches
•  Is Transparent
•  Recommends
•  Crowdsources

Based on:  Robin Good: Attention Doesn’t Scale – the Role of Content Curation in Membership Associations