

Charles Hugh Smith
The Status Quo is desperate to mask the declining fortunes of those who earn income from work, and the Misery Index 2.0 strips away the phony facade of bogus unemployment and inflation numbers.
The classic Misery Index is the sum of unemployment and inflation, though later variations have added interest rates and the relative shortfall or surplus of GDP growth.
Since the Status Quo figured out how to game unemployment and inflation to the point that these metrics are meaningless except as a meta-measure of centralized perception management, the Misery Index has lost its meaning as well.
I propose a Misery Index 2.0 of four less easily manipulated (and therefore more meaningful) metrics:
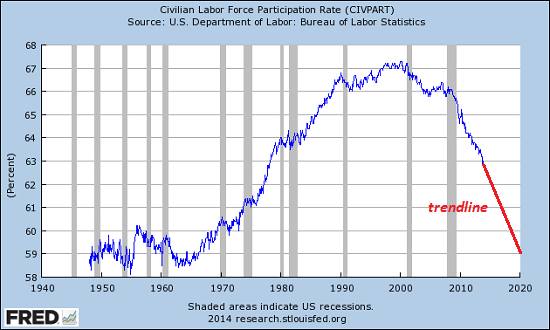
1. The participation rate: the percentage of the working-age population with a job
2. Real (adjusted for inflation) median household income: an imperfect but still useful measure of purchasing power
3. Labor share of the non-farm economy: how much of the national income is going to wage-earners
4. Money velocity: a basic measure of economic vitality
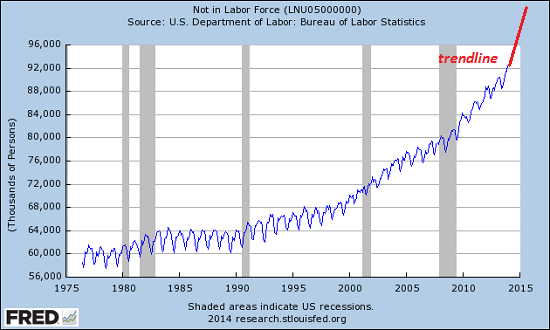
The foundation of Misery Index 2.0 is jobs, earned income and the purchasing power of earnings. Inflation is easily gamed by underweighting big-ticket expenses and offsetting increasing costs with hedonic adjustments, and unemployment is easily gamed by shifting people from the work-force to not in the workforce. This category of zombies–not counted in measures of unemployment–has skyrocketed:
The participation rate is the more telling metric: if fewer people of working age have jobs, the claim that the Main Street economy is “doing better” rings false.
Even though the rate of inflation is heavily gamed, real median household income is the best available gauge of purchasing power. Purchasing power simply means how many goods and services will your income buy?
For example: if your daily salary buys 20 gallons of gasoline, and a year from now you get a raise but your daily pay only buys 15 gallons of gasoline, the purchasing power of your earnings fell despite the higher nominal salary.
Real median household income has declined, meaning the purchasing power of earnings fell.
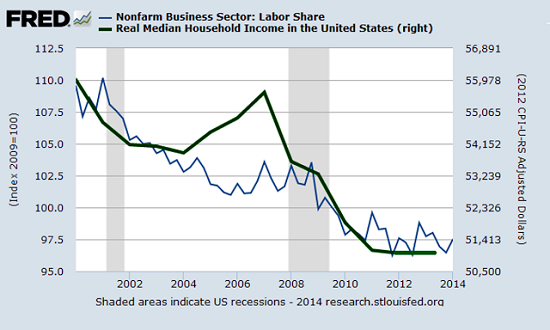
This chart also shows labor's share of the non-farm economy: that broad measure of earned income (as opposed to corporate profits, unearned income and rentier income) reflects a steady decline in labor's share of the national income.
Once again, claims that the Main Street economy is “doing better” make no sense if labor's share of the national income is declining.
An economy in rude good health has a high velocity of money. An economy bedeviled with high taxes, rentier skims, cartels, politically untouchable fiefdoms, quasi-monopolies and free money for financiers provided by the central bank has a declining velocity of money.
You can fake unemployment and inflation, but it's harder to paper over the weakness reflected in money velocity:

Central-planning always leads to ginned-up phony statistics, because centrally planned economies always stagnate due to corruption, malinvestments, and some are more equal than others skims and scams by insiders, cronies, cadres and apparatchiks.
The Status Quo is desperate to mask the declining fortunes of those who earn income from work, and the Misery Index 2.0 strips away the phony facade of bogus unemployment and inflation numbers.


