These 12 technologies will drive our economic future
Neil Irwin
Washington Post, 24 May 2013
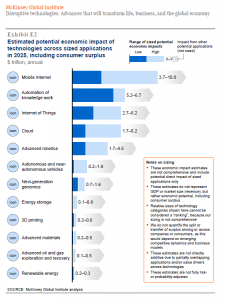
As the chart shows, the McKinsey folks believe that the most economically significant technologies over the next decade-plus will be those already well underway in their development — the mobile Internet, largely in place in the adv

Indeed, maybe the single biggest takeaway from the study is this: The things that will have the greatest impact on the economy in the medium term aren’t the ones that seem to most excite the imagination and public interest. Instead, the potentially powerful innovations are mostly those that have been evolving for many years in new ways.
. . . . . . . .
The real economic benefits of innovation, at least over the near term, come not from the flashy, mind-blowing ideas, but from clever combinations of technologies that are just maturing with those that have been around for ages.

ROBERT STEELE: I agree with McKinsey on one of these — mobile — and disagree with everything else. And in the case of mobile, McKinsey clearly has not make the intellectual leap from mobile as a “receive” node to mobile as a “production” node, which is precisely the point of my proposal to Sir Richard Branson (Virgin Truth 2.6) and my related concept for saving Microsoft from itself (Big Picture). See also my newest graphic, Graphic: Ugly First Look at Hand-Held Device Value for Harvesting Monetizable Knowledge. For McKinsey to even include “Advanced oil and gas exploitation and recovery” is for me a clear reflection of their reliance on the hype meter rather than sound analysis. They completely ignore the central role of water desalination and purification that will, in combination with distributed renewable energy (not centralized!), and new forms of energy storage both big (underground) and small (disks), change everything. Instead of the sea rising, it will be converted into fresh water that will restore the deserts and forests. The rest of their list is pedestrian. While interesting, their thinking is devoid of the human factor and its potential, and totally lacking in any suggestion as to the true cost of these listed technologies — 3D printing of food, for example, could well be genetic modification and toxin production on steroids, wiping out communities that indulge. Perhaps most distressing, the McKinsey list is devoid of the moral factor and the moral implications of the Interent and the ease with which humanity will be able to do multinational information-sharing and sense-making….McKinsey has evidently not heard of the ten high-level threats to humanity (as identified by the High Level Panel on Threats, Challenges, and Change, reporting out in Decmeber 2004) and they do not evaluate technologies in relation to their relevance to the eradication of those threats, all enabled by secrecy (means), corruption (way), and impunity (end).
See Also:
Graphic: Adoption of Technology Curves – Silent Boom
Graphic: Anthropocene Energy Channels & Nodes
Graphic: Africa, Cell Phone Impact
Graphic: Analytic Tool-Kit in the Cloud (CATALYST II)
Graphic: Beyond Water-Energy Nexus
Graphic: Centralized versus Decentralized Energy Paradigms
Graphic: Complex Earth Systems Model
Graphic: Declaration of Internet Freedom
Graphic: Difference Between a Boss and a Leader
Graphic: Digital Learners versus Analog Teachers
Graphic: Dutch Information Infrastructure Core Slide
Graphic: Eight “Tribes” or Communities of Information & Intelligence
Graphic: Elements of Intelligence
Graphic: Engineering Interventions
Graphic: Epoch B Swarm Leadership
Graphic: Ethical Evidence-Based Decisions
Graphic: Evaluating Intelligence (Decision-Support) – Four Aspects 1.1
Graphic: Fifteen Global Challenges (Millenium Project)
Graphic: Five Migration Paths from Peter Senge et all
Graphic: Four Major Systems for Resilience
Graphic: Four National Reforms
Graphic: Four Quadrants J-2 High Cell SMS Low
Graphic: Four World-Brain Web Sites in University of the 21st Century Context
Graphic: Fresh Water in Relation to All Water
Graphic: Global Range of Nano-Needs
Graphic: Global Risk Interconnnected with Cascade Potential
Graphic: Global Trends 2030 Water Stress
Graphic: Health Quadrants & Open Source Information
Graphic: Herring Triangle as Published in New Craft of Intelligence
Graphic: Human Intelligence (HUMINT) 102 (Right Way)
Graphic: Human Intelligence (HUMINT) J-2 Central
Graphic: IBM Big Data (Severely Retarded)
Graphic: Information Commons & Eight Tribes
Graphic: Information Continuum (1995)
Graphic: Information Operations (IO) Cube
Graphic: Information Operations (IO) Eras
Graphic: Information Pathologies
Graphic: Intelligence Requirements Definition for the 21st Century
Graphic: Intelligence Standards
Graphic: Internet2 Open Science Open Flow Concept
Graphic: Jim Bamford on the Human Brain
Graphic: Knowledge, Trust, & Development
Graphic: Knowledge Wheel (Intelligence 101)
Graphic: M4IS2 OpenBTS, Call Centers, Diasphora
Graphic: Majority Religion By Country
Graphic: Mali Food Insecurity, Refugees, & Islamists
Graphic: Medard Gabel’s Cost of Peace versus War
Graphic: MindMap Open Source Everything
Graphic: Mother Jones on Wealth, Productivity, & Wages
Graphic: Multi-Lateral Sharing
Graphic: Multi-Level Technical Approach to Intelligence 21
Graphic: Multi-Lingual Reality
Graphic: Multinational Decision-Support Centre Concept of Operations
Graphic: Multinational IO + OSINT = IO2
Graphic: Multinational Regional Intelligence-Operations Support Centre (Station)
Graphic: Network Learning Path to the Future
Graphic: Network-Oriented Resilience Metrics
Graphic: New Balance for the New Craft of Intelligence
Graphic: New Global Integrated Intelligence Community
Graphic: New Internet-Era Needs Triangle
Graphic: Next Net MindMap (Evolving)
Graphic: Old Versus New Intelligence Process
Graphic: One Vision for the Future of Microsoft
Graphic: Open Science Sharing is Caring
Graphic: Open Source Hardware Economic Model
Graphic: OODA Loop (Observe, Orient, Decide, Act)
Graphic: Open Data Value Model
Graphic: Open Source Everything – Open World
Graphic: Opening the World 1 of 2
Graphic: Opening the World 2 of 2
Graphic: Open Source Agency Clients & Commanders
Graphic: Open Source Agency Broad Concept
Graphic: Open Source Agency Broad Organization
Graphic: Organizational Tools for Changing Culture
Graphic: Original Banzai by Col Walt Breede III, USMC
Graphic: OSINT, Missions, & Disciplines
Graphic: OSINT, We Went Wrong, Leaping Forward
Graphic: Overview of Big Bat 21
Graphic: Panarchy as Ecological Resilience System
Graphic: Panarchy Pace Layering (Stewart Brand)
Graphic: Panarchy The Self in Hyperconnectivity
Graphic: Participatory Budget Outreach
Graphic: Participatory Polyarchy
Graphic: Pre-Conditions of Revolution
Graphic: Preconditions of Revolution in the USA Today
Graphic: Preliminary Holistic Analytic Model
Graphic: President and Humanity
Graphic: Principles of War versus Principles of Peace
Graphic: Public Governance & Feedback Loop Integrity Enhanced by Public Intelligence
Graphic: Public Governance in the 21st Century
Graphic: Reality 101 Reading Areas
Graphic: Reality 102 Strategic Forces Being Ignored
Graphic: Rebooting USA Operating System
Graphic: Regional Information-Sharing and Sense-Making Centre
Graphic: Regional Intelligence Center for Peacekeeping
Graphic: Robert Steele Adopts Buckminster Fuller
Graphic: Rolf Sattler’s Dynamic Mandala Map
Graphic: Satellite Bandwidth for Terrestial Use
Graphic: Science, Religion, & Philosophy
Graphic: Simplified Earth Systems Model
Graphic: Simplified World Conflict Map
Graphic: Six Circles–Earth Intelligence Network Operational Concept
Graphic: Smart Nation Through Four Reforms
Graphic: Smart Nation World Brain Pyramid
Graphic: Smart Safe Nation via Intelligence with Integrity in Four Quadrants – USA Fails
Graphic: Stages of Tribal Intelligence and Integrity
Graphic: Strategic Analytic Matrix
Graphic: Strategic Intelligence Secretariat United Nations
Graphic: Strategic Narrative Process Model
Graphic: Strategic Trends (Negative)
Graphic: Strategic Trends (Positive)
Graphic: Strategy for a Prosperous World at Peace
Graphic: Stress on Great Lakes Water + Water RECAP
Graphic: Ten High-Level Threats to Humanity
Graphic: The Four Quadrants of Knowledge
Graphic: The Internet of Things (Beecham Research)
Graphic: The New Craft of Intelligence
Graphic: The UN and the Eight Tribes of Intelligence
Graphic: The Virgin Truth Sir Richard Branson Connecting the Dots
Graphic: True Cost of Sugar to Society
Graphic: Truth, Love, & Power – Intelligence, Oneness, & Authority
Graphic: Twitter as an Intelligence Tool
Graphic: Two Economic Models — One Amoral, One Moral
Graphic: UN Big Picture View of Global Intelligence with Integrity Supporting Documents Added
Graphic: UN 1 Cost of Peace vs. Cost of War [Converted to Endnote]
Graphic: UN 1 One World — One Brain — Open Everything
Graphic: UN 2 Data-Driven Gift Need and Delivery Aggregation and Accountability
Graphic: UN 3 Bottom-Up Approach to Peace Governance
Graphic: UN 4 Data-Driven Public Governance
Graphic: UN 5 Open Source Everything (OSE) Circles
Graphic: UN 6 OSINT Relevance to UN Ten High-Level Threats
Graphic: UN 7 Intelligence Requirements Four Levels of Analysis
Graphic: UN 8 Information Strategy for 21st Century
Graphic: UN 9 Strategic Analytic Model for UN System Intelligence
Graphic: UN 10 – 2 Open Sources Limited Secret Sources Now, Plus Eight Tribes
Graphic: UN 11 UN-Centric Extended Circles of Information Sharing and Sense-Making
Graphic: UN 12 Overlay of UN Organizations with Strategic Threats & Policies
Graphic: UN 13 Earth Intelligence Network “Six Bubbles”
Graphic: UN 14 Open-Source Decision-Support Information Network (UNODIN) Pyramid
Graphic: UN 15 UNODIN as Service of the Commons — Five Layers
Graphic: USA Economic Split from 1980 Onwards
Graphic: USA Loss of Service Cascade from Electromagnetic Pulse Bombs
Graphic: US Drought 25 December 2012
Graphic: US Intelligence Six Fundamental Failures Over 25 Years – $1.25 Trillion
Graphic: US Military Bases World-Wide
Graphic: US Military Spending Adjusted for Inflation has DOUBLED from 1962 to 2012
Graphic: US Nuclear Plants in Earthquake Zones
Graphic: US Nuclear Plants in Flood Zones
Graphic: US Nuclear Risk in Relation to Dam Failures
Graphic: Water Wars (1990′s Depiction)
Graphic: Water-Centric Holistic Analysis
Graphic: Water and Cites–Urban Shortages
Graphic: Water Aquifers (Groundwater)
Graphic: Water Distribution, Water Wars
Graphic: Water Footprint Across Your Day…
Graphic: Water Stress & Biodiversity Threat
Graphic: Water Stress After Technology
Graphic: Water Stress (Global) in 2050
Journal: Brains Beat Algorithms….Again
Robert Garigue & Robert Steele: From Old IO to New IO
Robert Garigue: The Next Long Wave of Innovation
Robert Garigue: When Everything Else is Distributed….
Worth a Look: Wealth-Generating Economies


