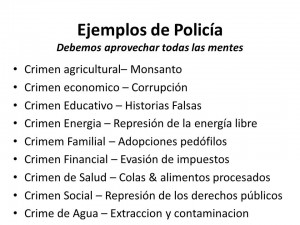
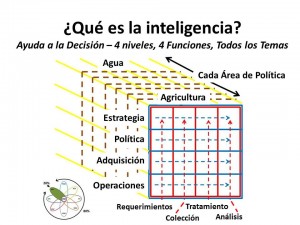
Grafico: Que es la Inteligencia? 4 niveles, 4 funciones, todas las temas
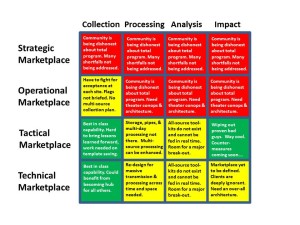
AA Espanol, Policies-Harmonization, Strategy-Holistic Coherence, ThreatsGraphic: Persistent Surveillance Stoplight Chart
Analysis, Balance, Capabilities-Force Structure, Collection, Corruption, Geospatial, ICT-IT, Processing, Reform, Strategy-Holistic Coherence, Threats, True CostGraphic: World Water Risk 2014
Balance, Citizen-Centered, Earth Orientation, Resilience, Threats, True Cost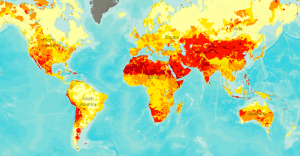
QUOTE: When we say we have a global water crisis, we mean it. The World Resource Institute use a mapping tool called Aqueduct to help companies, investors, governments, and the public understand the global water stress and risks. Notice the similarities with the previous map now? You should. While there is opportunity for agriculture in sub-Saharan Africa, Northern Africa and parts of Southern Africa face high risk of water scarcity.
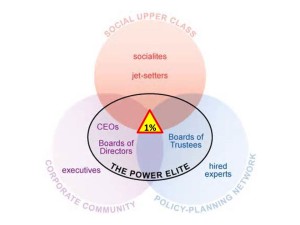
Graphic: Who Rules America
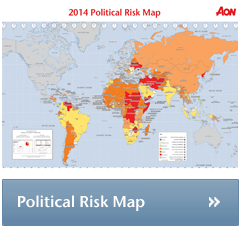
Analysis, Balance, Budgets & Funding, Citizen-Centered, Corruption, Leadership-Integrity, Policies-Harmonization, Political, Reform, Strategy-Holistic Coherence, Threats, Tribes, True CostGraphic: 2014 Political Risk Map
ThreatsContributing Editor Berto Jongman
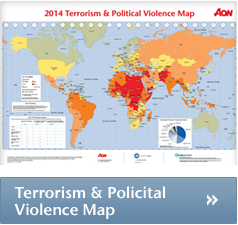
Graphic: 2014 Terrorism & Political Violence Map
ThreatsContributing Editor Berto Jongman
 Commercial Product for Sale