Patrick Meier: Could Lonely Planet Render World Bank Projects More Transparent?

Access, Crowd-Sourcing, Geospatial, Innovation, Resilience
Patrick Meier
Patrick Meier

Could Lonely Planet Render World Bank Projects More Transparent?

That was the unexpected question that my World Bank colleague Johannes Kiess asked me the other day. I was immediately intrigued. So I did some preliminary research and offered to write up a blog post on the idea to solicit some early feedback. According to recent statistics, international tourist arrivals numbered over 1 billion in 2012 alone. Of this population, the demographic that Johannes is interested in comprises those intrepid and socially-conscious backpackers who travel beyond the capitals of developing countries. Perhaps the time is ripe for a new form of tourism: Tourism for Social Good.

There may be a real opportunity to engage a large crowd because travelers—and in particular the backpacker type—are smartphone savvy, have time on their hands, want to do something meaningful, are eager to get off the beaten track and explore new spaces where others do not typically trek. Johannes believes this approach could be used to map critical social infrastructure and/or to monitor development projects. Consider a simple smartphone app, perhaps integrated with existing travel guide apps or Tripadvisor. The app would ask travelers to record the quality of the roads they take (with the GPS of their smartphone) and provide feedback on the condition, e.g.,  bumpy, even, etc., every 50 miles or so.

They could be asked to find the nearest hospital and take a geotagged picture—a scavenger hunt for development (as Johannes calls it); Geocaching for Good? Note that governments often do not know exactly where schools, hospitals and roads are located. The app could automatically alert travelers of a nearby development project or road financed by the World Bank or other international donor. Travelers could be prompted to take (automatically geo-tagged) pictures that would then be forwarded to development organizations for subsequent visual analysis (which could easily be carried out using microtasking). Perhaps a very simple, 30-second, multiple-choice survey could even be presented to travelers who pass by certain donor-funded development projects. For quality control purposes, these pictures and surveys could easily be triangulated. Simple gamification features could also be added to the app; travelers could gain points for social good tourism—collect 100 points and get your next Lonely Planet guide for free? Perhaps if you’re the first person to record a road within the app, then it could be named after you (of course with a notation of the official name). Even Photosynth could be used to create panoramas of visual evidence.

Continue reading “Patrick Meier: Could Lonely Planet Render World Bank Projects More Transparent?”
Patrick Meier: Analysis of Multimedia Shared on Twitter After Tornado — Instagram Rules

Crowd-Sourcing, Geospatial, P2P / Panarchy, Resilience, Software, Transparency
Patrick Meier
Patrick Meier

Analysis of Multimedia Shared on Twitter After Tornado

Humanitarian organizations and emergency management offices are increasingly interested in capturing multimedia content shared on social media during crises. Last year, the UN Office for the Coordination of Humanitarian Affairs (OCHA) activated the Digital Humanitarian Network (DHN) to identify and geotag pictures and videos shared on Twitter that captured the damage caused by Typhoon Pablo, for example. So I’ve been collaborating closely with my colleague Hemant Purohit to analyze the multimedia content shared by millions of tweets  posted after the Category 5 Tornado devastated the city of Moore, Oklahoma on May 20th. The results are shared below along with details of a project I am spearheading at QCRI to provide disaster responders with relevant multimedia content in real time during future disasters.

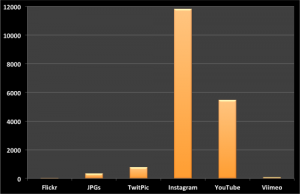
Click on Image to Enlarge

For this preliminary multimedia analysis, we focused on the first 48 hours after the Tornado and specifically on the following multimedia sources/types: Twitpic, Instagram, Flickr, JPGs, YouTube and Vimeo. JPGs refers to URLs shared on Twitter that include “.jpg”. Only ~1% of tweets posted during the 2-day period included URLs to multimedia content. We filtered out duplicate URLs to produce the following unique counts depicted above and listed below.

  • Twitpic = 784
  • Instagram = 11,822
  • Flickr = 33
  • JPGs = 347 
  • YouTube = 5,474
  • Vimeo = 88

Clearly, Instagram and Youtube are important sources of multimedia content during disasters. The graphs below (click to enlarge) depict the frequency of individual multimedia types by hour during the first 48 hours after the Tornado. Note that we were only able to collect about 2 million tweets during this period using the Twitter Streaming API but expect that millions more were posted, which is why access to the Twitter Firehose is important and why I’m a strong advocate of Big Data Philanthropy for Humanitarian Response.

Read full post with more graphs.

Patrick Meier: Exploiting Tweets and Online Gamers

Crowd-Sourcing, Geospatial
Patrick Meier
Patrick Meier

Results: Analyzing 2 Million Disaster Tweets from Oklahoma Tornado

Thanks to the excellent work carried out by my colleagues Hemant Purohit and Professor Amit Sheth, we were able to collect 2.7 million tweets posted in the aftermath of the Category 4 Tornado that devastated Moore, Oklahoma. Hemant, who recently spent half-a-year with us at QCRI, kindly took the lead on carrying out some preliminary analysis of the disaster data. He sampled 2.1 million tweets posted during the first 48 hours for the analysis below.  Read full post.

How Online Gamers Can Support Disaster Response

FACT: Over half-a-million pictures were shared on Instagram and more than 20 million tweets posted during Hurricane Sandy. The year before, over 100,000 tweets per minute were posted following the Japan Earthquake and Tsunami. Disaster-affected communities are now more likely than ever to be on social media, which dramatically multiplies the amount of user-generated crisis information posted during disasters. Welcome to Big Data—Big Crisis Data.

Humanitarian organizations and emergency management responders are completely unprepared to deal with this volume and velocity of crisis information. Why is this a problem? Because social media can save lives. Recent empirical studies have shown that an important percentage of social media reports include valuable, informative & actionable content for disaster response. Looking for those reports, however, is like searching for needles in a haystack. Finding the most urgent tweets in an information stack of over 20 million tweets (in real time) is indeed a major challenge.  Read full post.

Patrick Meier: Automatic Processing of Tweets & Crowd-Sourced Reports

Crowd-Sourcing, Data, Geospatial, Innovation, Mobile
Patrick Meier
Patrick Meier

Automatically Classifying Crowdsourced Election Reports

As part of QCRI’s Artificial Intelligence for Monitoring Elections (AIME) project, I liaised with Kaggle to work with a top notch Data Scientist to carry out a proof of concept study. As I’ve blogged in the past, crowdsourced election monitoring projects are starting to generate “Big Data” which cannot be managed or analyzed manually in real-time. Using the crowdsourced election reporting data recently collected by Uchaguzi during Kenya’s elections, we therefore set out to assess whether one could use machine learning to automatically tag user-generated reports according to topic, such as election-violence. The purpose of this post is to share the preliminary results from this innovative study, which we believe is the first of it’s kind.

Read full post with graphics.

Over 1 Million Tweets from Oklahoma Tornado Automatically Processed

My colleague Hemant Purohit at QCRI has been working with us on automatically extracting needs and offers of help posted on Twitter during disasters. When the 2-mile wide, Category 4 Tornado struck Moore, Oklahoma, he immediately began to collect relevant tweets about the Tornado’s impact and applied the algorithms he developed at QCRI to extract needs and offers of help.

Read full post

Patrick Meier: China Case Study in Disaster Response from Government versus Crowd-Sourced

Crowd-Sourcing, Geospatial
Patrick Meier
Patrick Meier

How Crowdsourced Disaster Response in China Threatens the Government
In 2010, Russian volunteers used social media and a live crisis map to crowdsource their own disaster relief efforts as massive forest fires ravaged the country. These efforts were seen by many as both more effective and visible than the government’s response. In 2011, Egyptian volunteers used social media to crowdsource their own humanitarian convoy to provide relief to Libyans affected by the fighting. In 2012, Iranians used social media to crowdsource and coordinate grassroots disaster relief operations following a series of earthquakes in the north of the country. Just weeks earlier, volunteers in Beijing crowd-sourced a crisis map of the massive flooding in the city. That map was immediately available and far more useful than the government’s crisis map. In early 2013, a magnitude 7  earthquake struck Southwest China, killing close to 200 and injuring more than 13,000. The response, which was also crowdsourced by volunteers using social media and mobile phones, actually posed a threat to the Chinese Government.

. . . . . . .

Aided by social media and mobile phones, grassroots disaster response efforts present a new and more poignant “Dictator’s Dilemma” for repressive regimes. The original Dictator’s Dilemma refers to an authoritarian government’s competing interest in using information communication technology by expanding access to said technology while seeking to control the democratizing influences of this technology. In contrast, the “Dictator’s Disaster Lemma” refers to a repressive regime confronted with effectively networked humanitarian response at the grassroots level, which improves collective action and activism in political contexts as well. But said regime cannot prevent people from helping each other during natural disasters as this could backfire against the regime.

Read full post.

Berto Jongman: Interactive Political Risk Map

Analysis, Geospatial, Worth A Look
Berto Jongman
Berto Jongman

Map Format Options

Note: Political Risk Map and Terrorism Risk Map are hosted on the same website. Use the same login credentials to access both.  Click the links below to access:

PDF Version

Online Version for 2013 Data Only (no registration required)

Login to Online Historical Maps and Analytics (if you already registered)

Value added features of Interactive Risk Map

Exposure Calculator Screen Shot Map Analysis Screen Shot
Exposure Calculator allows clients to measure their financial exposures against country risk. Map Analysis allows clients to measure countries against each other over time.

Click here for web page to register for access to historical maps and supporting analytics.

Neal Rauhauser: Drowning IndoChina

03 Environmental Degradation, Geospatial
Neal Rauhauser
Neal Rauhauser

Drowning Indochina

Yesterday’s Visualizing 400ppm Carbon Dioxide showed before/after coastline maps of what we can expect given the carbon we have already put into the atmosphere. All of Delaware and Maryland’s eastern shore disappear, Florida south of Gainesville goes for a swim, and the San Francisco Bay reaches Sacramento.

The effects in Indochina and neighboring Bangladesh are even more profound. Yangon, Myanmar (4.4M), Bangkok, Thailand (8.3M), Ho Chi Minh City, Vietnam (7.5M), and Phnom Penh, Cambodia (2.3M) will all be submerged if the increase is only 20M and historically we should expect more like 25M at that level of CO2.

Read full post and see maps.