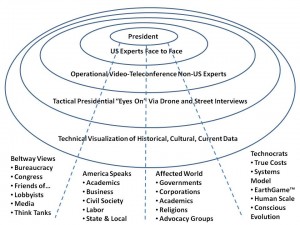
Forthcoming in Strategic Studies Institute Mongraph on Human Intelligence (HUMINT) approved for publication by CIA and DoD. In the interim, can be seen at www.oss.net/HUMINT.

Forthcoming in Strategic Studies Institute Mongraph on Human Intelligence (HUMINT) approved for publication by CIA and DoD. In the interim, can be seen at www.oss.net/HUMINT.

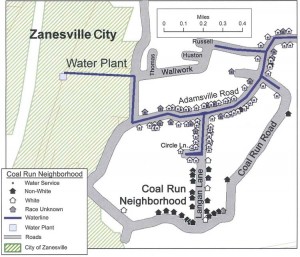
GIS mapping technology is helping underprivileged communities get better services — from education and transportation to health care and law enforcement — by showing exactly what discrimination looks like.
The institute's maps played a vital role in a federal jury's decision last year to award the excluded Coal Run residents almost $11 million in damages from the city of Zanesville and Muskingum County. The supporting evidence was strong on its own: African-American residents without water had made repeated requests over a period of almost 50 years to remedy the inequity, to no avail. Instead, they had to haul water from the plant or pump it from wells contaminated with sulphur and oil from old mining operations. In the interim, Zanesville had extended its water lines on numerous occasions to new, predominantly white developments that were farther away from the water plant than Coal Run.
Bob Burtman is a freelance investigative reporter and researcher who lives with his wife and animals in the woods outside of Hillsborough, N.C. He has won numerous national and regional journalism awards for his stories on the…
Phi Beta Iota: This is precisely what we have been looking for–the use of information as a non-violent means of achieving equity. This is HUGE in our view, and a tiny micorcosm of how We the People in the aggregate will sort out the massive concentration of wealth that has been made possible by corruption, fraud, waste, and abuse all condoned and made possible by the Republican and Democratic parties in collusion with Wall Street (and especially Goldman Sachs).

2009 The Ultimate Hack: Re-Inventing Intelligence to Re-Engineer the World

Graphic Now Leads to JPEG of This Graphic Only (Re-Use is Encouraged!)