Anthony Judge: Can NATO Learn to Think for Itself?

Cultural Intelligence, Ethics, Government, Non-Governmental, Peace Intelligence
0Shares
Anthony Judge
Anthony Judge

I have been mulling over your post, 2013 Robert Steele Reflections on NATO 4.0 — Key Challenges AND Solutions [Written for NATO ACT Innovation Hub].

My sense, for myself, is that we have moved into a new cognitive space in which issues of comprehensibility, credibility and deliverability become fundamental in a context in which attention time is limited.

I no longer think that rational articulations can be either comprehended or delivered — other than use of missiles, if that is to be framed as rational.

Little attention is given to the decision-making dynamics and what to do with those who disagree — other than to design them out

Also of relevance is how to design in that which others perceive as having been designed out.

I think the scope for dialogue on such matters is now very limited. It is interesting to note the messy range of comments on any proposed scheme in a newspaper article. There is no scope or suggestion to map those in any meaningful way. The assumption is that some are “wrong” and some are “right” — with each variously labeling the other. No use is made of argument mapping techniques. Why is the interesting question.

Continue reading “Anthony Judge: Can NATO Learn to Think for Itself?”

Robin Good: Web Scraping Tools, Services, and Plug-Ins — A Comprehensive List

IO Tools
0Shares
Robin Good
Robin Good

Software for Web Scraping

There are many web data extraction programs and some cloud services available and they vary widely in cost and features. In this post, we’ve summarized them below to help you to make your choice. All of these programs have been either tested by us or have been in general use for web ripping. We hope these brief overviews and the following reviews will help you choose a web scraper for your purposes.

Continue reading “Robin Good: Web Scraping Tools, Services, and Plug-Ins — A Comprehensive List”

Winslow Wheeler: Graphics Lie — and Tell the Truth — Actual Pentagon Budget Part II

03 Economy, 10 Security, DoD, Ethics, Government, Ineptitude, Military
0Shares
Winslow Wheeler
Winslow Wheeler

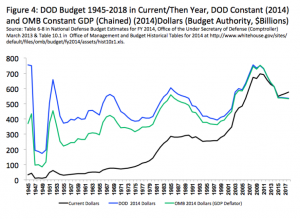
“If Congress goes along [by approving President Obama's 2014 DOD budget request], Pentagon spending levels will exceed any previous high by any other president in any year in peace or in war since the death of President Roosevelt in 1945, except for President George W. Bush from 2006 to 2008.”

“…current military spending is lapping at historic highs, not lows.”

How can that be?  The explanation follows; it is also at Time's Battleland blog.

Correcting the Pentagon's Distorted Budget History

The Defense Budget Is Even Larger Than You Think: part two of two

Given the warped measures that high-spending advocates and the Defense Department use to calibrate past, present and future defense spending (described here Monday), it is important to find an independent, objective yardstick to measure Pentagon spending trends accurately.

Unfortunately, there isn't one.

If there were, this debate would be over, and I could retire.

Click on Image to Enlarge

The Bureau of Economic Analysis in the Commerce Department might be tasked with the job of finding one, but it actually plays a major role in devising the Pentagon's self-serving measures of inflation. The Office of Management and Budget has its own deflators that are only slightly different.

Both embrace the proposition that a large portion of cost growth in Pentagon spending should be counted as inflation: the Pentagon experiences more inflation than other agencies and should get more money-the argument goes.

In the 1980s, the Congressional Military Reform Caucus argued that the Pentagon should be held to an independent but analogous measure of inflation, and identified the Producer Price Index as most appropriate. Others, especially the Defense Department, disagreed.

The differences will not be resolved here, but the question remains: what would the Pentagon's budget history look like if it lived by the rules followed by most everyone else – especially the rest of the federal government, and the American economy?

Continue reading “Winslow Wheeler: Graphics Lie — and Tell the Truth — Actual Pentagon Budget Part II”

SmartPlanet: The world peaked in 1978

03 Economy, 06 Family, 11 Society, SmartPlanet
0Shares

smartplanet logoThe world peaked in 1978

A new study of global wealth says prosperity peaked around 1978, and we’ve been heading downhill ever since. New Scientist reports.

Governments have tended to build economic policies around gross domestic product (GDP), the sum of all monetary transactions in an economy. GDP has risen fairly steadily — and often dramatically — since the second world war, implying the world has become more prosperous. Critics point out, however, that GDP only tells part of the story.

For a more comprehensive measure — one that accounts for social factors and environmental costs — economists started using the Genuine Progress Indicator (GPI). It adjusts expenditure in 26 ways to account for costs like pollution, crime and inequality, and for beneficial activities where no money changes hands, such as housework and volunteering.

Continue reading “SmartPlanet: The world peaked in 1978”

SmartPlanet: Africa Boom Held Back by Infrastructure Gap — China Investing, Rail Could Be Next Thing

03 Economy, 08 Wild Cards, Earth Intelligence
0Shares

smartplanet logoAfrica is the world’s fastest growing continent

The number of Africans living below the poverty line has fallen dramatically and the business climate is good. So what's holding back the fastest growing continent in the world?

With a projected average growth rate of 6 percent from 2013-2015 and one-third of African countries with economic growth rates currently above 6 percent, the African Development Bank says that Africa is now the fastest growing continent in the world.

In a new report, the African Development Bank Group says that 350 million Africans now earn between $2 and $20 a day as the share of the population living below the poverty line has fallen from 51 percent to 39 percent.

Continue reading “SmartPlanet: Africa Boom Held Back by Infrastructure Gap — China Investing, Rail Could Be Next Thing”

Patrick Meier: Social Media = Resilience [Sub-Text Demands Free Cell Phones for Five Billion Poorest]

Crowd-Sourcing, Culture, Design
0Shares
Patrick Meier
Patrick Meier

Using Social Media to Predict Disaster Resilience

Social media is used to monitor and predict all kinds of social, economic, political and health-related behaviors these days. Could social media also help identify more disaster resilient communities? Recent empirical research reveals that social capital is the most important driver of disaster resilience; more so than economic and material resources. To this end, might a community’s social media footprint indicate how resilience it is to disasters? After all, “when extreme events at the scale of Hurricane Sandy happen, they leave an unquestionable mark on social media activity” (1). Could that mark be one of resilience?

Read full article.  Core graphic below.

Continue reading “Patrick Meier: Social Media = Resilience [Sub-Text Demands Free Cell Phones for Five Billion Poorest]”

Neal Rauhauser: Visualizing the Global Terrorism Database

Cultural Intelligence, Government, Ineptitude, Military, Peace Intelligence
0Shares
Neal Rauhauser
Neal Rauhauser

Visualizing the Global Terrorism Database

I received a cryptic note from a colleague earlier tonight:

“This one has time AND location data.”

The email contained a link to the Global Terrorism Database, which is maintained at the University of Maryland at College Park, which is an easy walk from a green line stop on the D.C. Metro. I poked around the site a bit and discovered that everything from 1970 through 2011 is available for download if you just fill out a form.

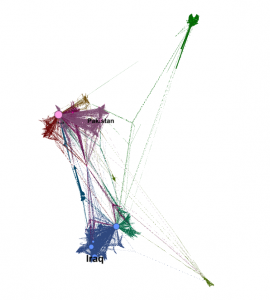
Click on Image to Enlarge

The total content is large so I pulled out the 5,066 events from 2011. There are an amazing 127 attributes for each event, but it’s a sparse row setup, very easy to process. I unrolled just a few key items – city, country, and region. This resulted in over 15,000 lines indexed with their twelve digit event IDs. The first rough visualization I did was immediately exciting in terms of what was visible.

Read full article with additional graphics.

Continue reading “Neal Rauhauser: Visualizing the Global Terrorism Database”