Reference: Citation Analytics 201

About the Idea, Advanced Cyber/IO, Analysis, Analysis, Articles & Chapters, Augmented Reality, Balance, Budgets & Funding, Collaboration Zones, Collective Intelligence, Communities of Practice, History, ICT-IT, info-graphics/data-visualization, InfoOps (IO), Maps, Methods & Process, Multinational Plus, Policies, Policies-Harmonization, Policy, Political, Politics of Science & Science of Politics, Power Behind-the-Scenes/Special Interests, Processing, Real Time, Research resources, Secrecy & Politics of Secrecy, Strategy-Holistic Coherence, Threats, Tools, Tribes

Phi Beta Iota: Most serious analysts now understand Citation Analytics 101.  It's time to move to Citation Analytics 202, and there is no better way to introduce the art of the possible than by pointing to Kevin W. Boyack, Katy Borner, and Richard Klavans (2007), “Mapping the Structure and Evolution of Chemistry Research (11th International Conference of Scientometrics and Infometrics, pp. 112-123.
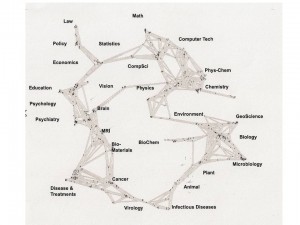
Full Article with Color Graphics
Graphic as Printable Single Page PPT

There are several take-aways from this article, which is more or less the “coming out” of the Klavens-inspired infometrics field now that he has won his law-suit and has unchallenged access to all Institute of Scientific Information (ISI) access [this was one of the sources we used to win the Burundi Exercise before the Aspin-Brown Commission in 1995].
Continue reading “Reference: Citation Analytics 201”

Search: Information Mapping (2010 Update)

Augmented Reality, Budgets & Funding, info-graphics/data-visualization, IO Mapping, Maps, Methods & Process, Searches, Tools, True Cost

Below is updated information followed by the original response.

With the permission of Robert Horn, a co-founder of Earth Intelligence Network and also the “owner” of the term “information mapping,” we have posted his seminal work in easy to download and exploit segments:

Reference: Mapping Hypertext (1989)

Latest example of Robert Horn's work:

Reference: Sustainable World by 2050

Below: Two “New Media” Programs, One Pace-Setting Informatics Program, Comment, and original 2009 search response.

Continue reading “Search: Information Mapping (2010 Update)”

Journal: Human-Centered Computing (Not…)

Analysis, Augmented Reality, Civil Society, Collective Intelligence, Counter-Oppression/Counter-Dictatorship Practices, info-graphics/data-visualization, InfoOps (IO), IO Multinational, Open Government, Reform

Human-centered computing should be–but is not today–about connecting all humans with all information in near-real-time, while providing back office tools that elevate the human brain and more properly plan information and communications technologies in a support role.  See for example our Citizen-Centered Graphics and all of the OSS/EIN Books.  Where the emergent meme is off-target is in focusing on the relationship of the computer to the individual, rather than the whole.  Hacking Humanity is the new meme.

TRADITIONAL

Human-Centered Computing (Wikipedia)
Human-Centered Computing Cluster (HCC)
Human-Centered Computing in Education (Links)
Human-Centered Computing: A Multi-Media Perspective (PDF circa 2005)

WORLD-BRAIN ORIENTATION

Review: The World Is Open–How Web Technology Is Revolutionizing Education
Review: Making Learning Whole–How Seven Principles of Teaching can Transform Education
Review (Guest): Cognitive Surplus–Creativity and Generosity in a Connected Age
2010: Human Intelligence (HUMINT) Trilogy Updated
Review: Holistic Darwinism: Synergy, Cybernetics, and the Bioeconomics of Evolution
Review: Consilience–the Unity of Knowledge
Review: The Unfinished Revolution–Human-Centered Computers and What They Can Do For Us
Review: Philosophy and the Social Problem–The Annotated Edition

See Also:

Worth a Look: Book Reviews on Technology & Web 2.0 to 4.0

Infographic: The Effects of Coal on Water in the US

03 Environmental Degradation, 05 Energy, 12 Water, info-graphics/data-visualization, True Cost, True Cost

See the article from CircleofBlue.com

August 16, 2010

The contest between coal-fired energy production and water demand is a mismatch. Mining and burning coal accounts for half of all water withdrawals in the United States, which is the same amount of water that pours over Niagara Falls in five months. Burning coal in power plants also is the source of more climate-changing carbon emissions than any other industrial sector. Here’s a look at the economically essential and ecologically damaging accord between coal and water.

Worth a Look: CrowdMap (Beta)

Advanced Cyber/IO, Analysis, Augmented Reality, Citizen-Centered, Collective Intelligence, Collective Intelligence, Counter-Oppression/Counter-Dictatorship Practices, Earth Intelligence, Geospatial, Historic Contributions, info-graphics/data-visualization, InfoOps (IO), Intelligence (government), International Aid, IO Mapping, Journalism/Free-Press/Censorship, Maps, Methods & Process, microfinancing, Mobile, Officers Call, Open Government, Policy, Reform, Research resources, Technologies, Tools, Worth A Look

Crowdmap (Liquida)

Crowdmap allows you to…

+ Collect information from cell phones, news and the web.
+ Aggregate that information into a single platform.
+ Visualize it on a map and timeline.

Crowdmap is designed and built by the people behind Ushahidi, a platform that was originally built to crowdsource crisis information. As the platform has evolved, so have its uses. Crowdmap allows you to set up your own deployment of Ushahidi without having to install it on your own web server.

See Also:

Graphics: Twitter as an Intelligence Tool

Reference: How to Use Twitter to Build Intelligence

Journal: Tech ‘has changed foreign policy’

Continue reading “Worth a Look: CrowdMap (Beta)”

Worth a Look: Clay Shirky on Cognitive Surplus & Crisis Mapping

Augmented Reality, Collaboration Zones, Collective Intelligence, Communities of Practice, Counter-Oppression/Counter-Dictatorship Practices, info-graphics/data-visualization, InfoOps (IO), International Aid, IO Sense-Making, Journalism/Free-Press/Censorship, Maps, Methods & Process, Policies, Tools, Worth A Look

About this talk

Clay Shirky looks at “cognitive surplus” — the shared, online work we do with our spare brain cycles. While we're busy editing Wikipedia, posting to Ushahidi (and yes, making LOLcats), we're building a better, more cooperative world.  TED Video of Talk.

About Clay Sharpey

Clay Shirky believes that new technologies enabling loose ­collaboration — and taking advantage of “spare” brainpower — will change the way society works.  Learn more.

Core Point: Over a trillion hours a year in cognitive surplus–Internet and media tools are shifting all of us from consumption to production.  We like to create; we like to share.  Now we can.

More From TED on The Rise of Collaboration

Recommended by Dr. Kent Myers.  His additional commentary:

This talk gets at something that could go into the proposal for Virtual Systemic Inquiry (VSI).  I need to emphasize that the VSI products have civic value.  That motivates participation, but we also need to make it a little more obvious and easy how to participate, in order that generosity can flow more readily from more people.  That's what I was trying to get at by making projects more standardized and quick.  Software can let that flow, as Shirky says.  The process and products should probably be pretty in some way too, like IDEO (also LOL cats).

Event: 7-30 Sept 2010, San Diego CA, World Resources Simulation Center Demo

04 Education, 05 Energy, 12 Water, Augmented Reality, Earth Intelligence, Geospatial, info-graphics/data-visualization, Technologies, Videos/Movies/Documentaries
Simulation demo event link

The philosophical foundation for The WRSC is in its founding premise stated as a question posed in R. Buckminster Fuller's World Game™ simulation:

“How do we make the world
work for 100% of humanity
in the shortest possible time
through spontaneous
cooperation without
ecological damage or
disadvantage to anyone?”

The World Resources Simulation Center (WRSC) will be a non-profit visualization facility where you can literally “see” the critical trends of global and regional issues, the relationships between issues, and the consequences of different strategies. For detailed information, begin by downloading the proposal documents to learn more about the specifics of the project. Next, explore several quick demonstrations of new technologies and how data and mapping information can be utilized in powerful new ways.  (videos follow, continue with post) Continue reading “Event: 7-30 Sept 2010, San Diego CA, World Resources Simulation Center Demo”